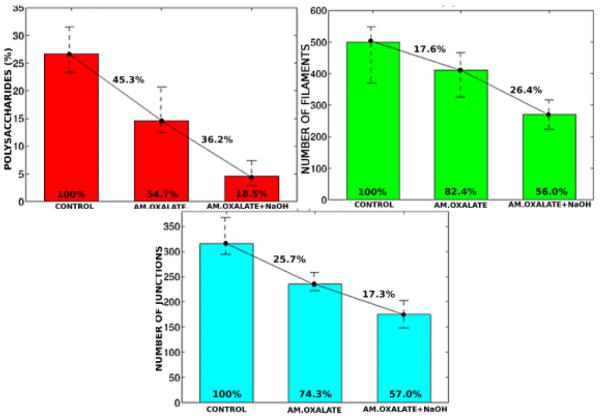
Figure 9.
Quantification of the plant cell wall composition across chemical treatments. (Top left) Volume of polysaccharides per treatment relative to whole imaged volume; (top right) number of filaments per treatment; (bottom) number of junctions per treatment. Bars show the average value among replicates within each treatment category. The error lines represent the variation between minimum and maximum values within replicates from the same treatment category. Cross lines show the composition change across treatments, while numbers inside the bars represent their height, both in percentage.

