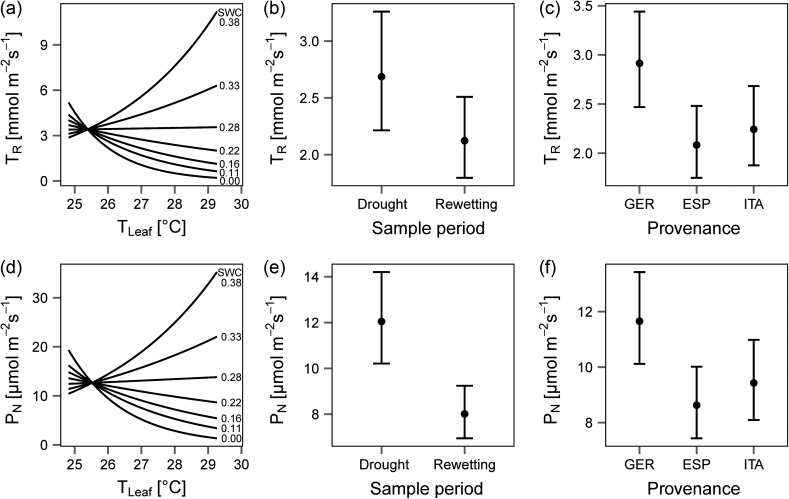
Figure 2.
Effect plots of the linear model for daytime evapotranspiration rates (TR) (top row) and daytime net photosynthesis rates (PN) (bottom row). Panels display the significant effects of (a, d) TLeaf and SWC interactions (see numbers at end of each line), (b, e) sample period and (c, f) provenance. Error bars represent the standard error. Confidence intervals in plots (a) and (d) are not presented for readability.

