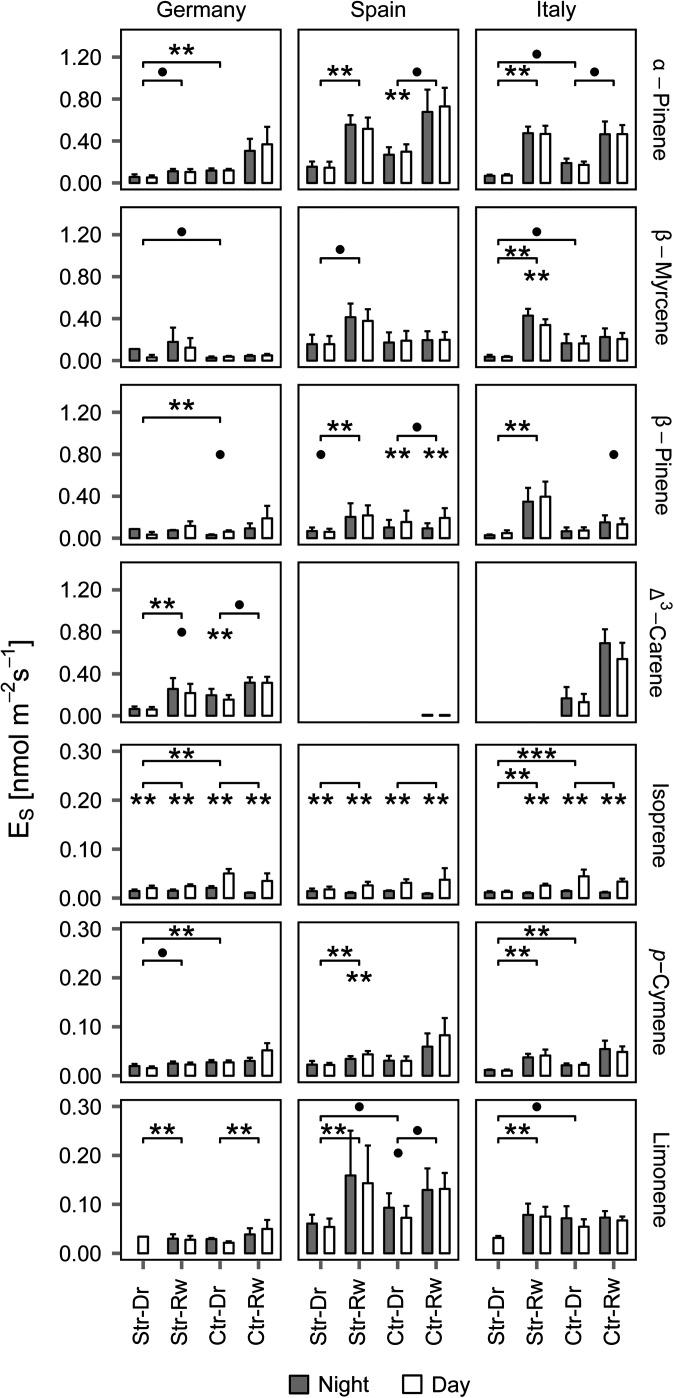
Figure 4.
Mean daytime and night-time emission rates (normalised to 25 °C (ES) by Guenther 93 algorithm) of each quantified compound and provenance separated by treatment and experiment (Str = stressed, Ctr = control, Dr = drought, Rw = rewetting). Bars represent the mean daytime or night-time values of each treatment group and experiment and error bars the standard error. Compounds are ordered in their relative magnitudes (see different scales). Asterisks over bars and brackets represent significant results (***P < 0.01, **P < 0.05, •P < 0.1) of the group comparisons in three levels: the lower level shows differences between day and night (Mann–Whitney, paired, above bars), the mid-level between both experiment for control and stressed Mann–Whitney, paired) and top-level differences between stressed and control group during drought sample period (Mann–Whitney, non-paired). N = 6 for each group, experiment and time. Further group statistics can be found in Supplementary Tables S3 and S4 available at Tree Physiology Online.

