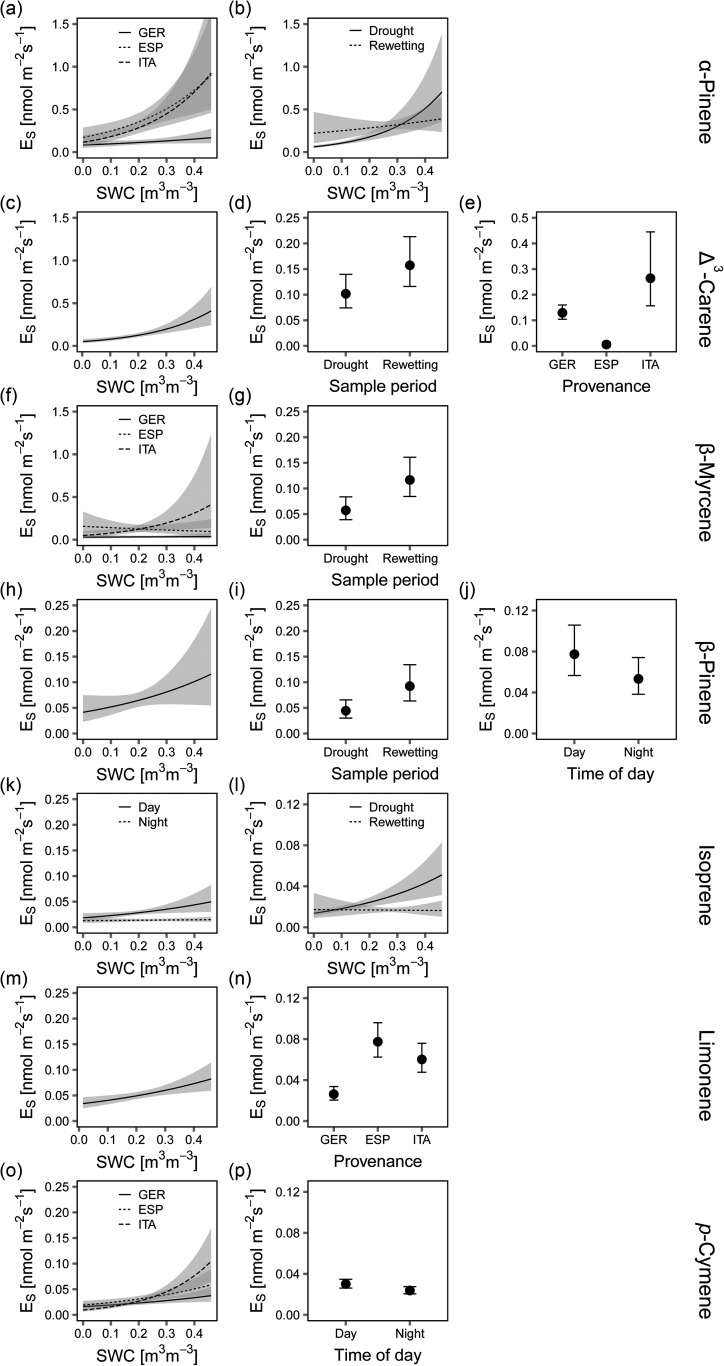
Figure 5.
Effect plots for the variables and interactions with volumetric soil water content (SWC) (a, b, f, k, l and o) of the linear models for each single compound emission (variables selected individually for each compound by AIC). Error bars and ribbons represent the standard error and confidence interval, respectively.

