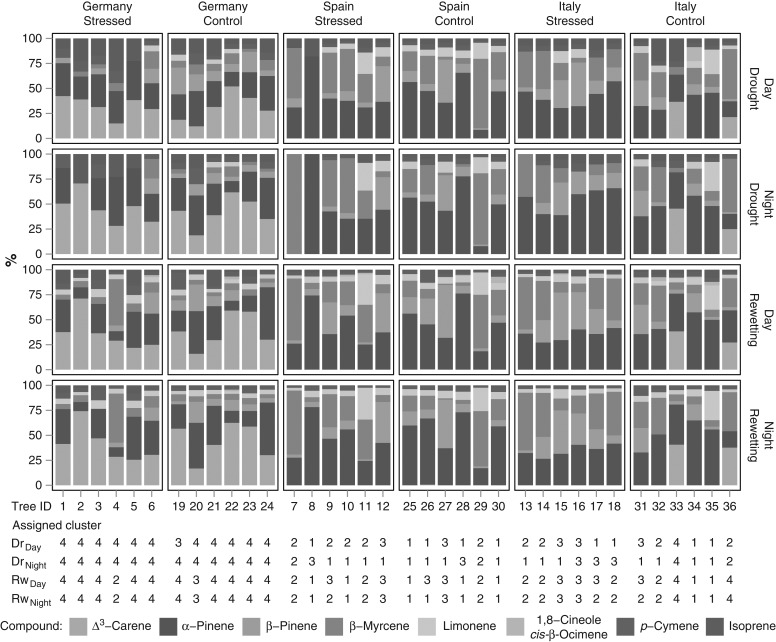
Figure 6.
Fractions of quantified compounds per single tree. Compounds under the detection limit were handled as zero values; mean daytime and night-time fractions are shown. Plot splits between each sample period, provenance, treatment and time of day. Tree ID represents each individual measured tree and cluster the determined cluster from Table 2 for each sample period (drought: Dr/rewetting: Rw) and time of day (Day/Night).

