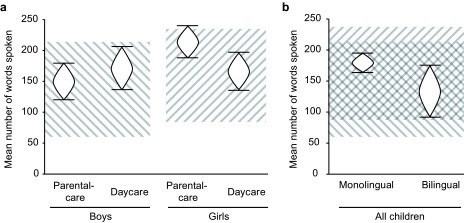
Figure 6.
95% CI s around mean number of words spoken by boys and girls in different care groups (a) as well as mono- and bilingual children (b). Cross-hatched areas mark ±1 SD around the mean number of words spoken by 24-month-old boys (lines from top-left to bottom-right) and girls (lines from bottom-left to top-right) in the norm sample of the Eltern Antworten (EL AN) questionnaire’s manual (Bockmann & Kiese-Himmel, 2006).

