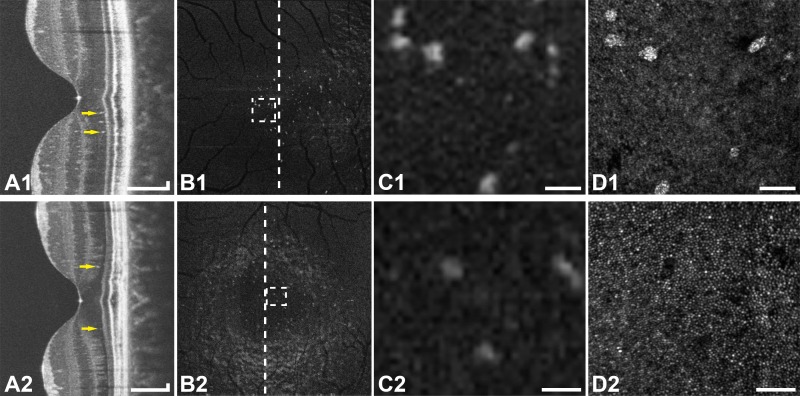
Figure 3.
Multimodal imaging of resolved CSC in subjects JK_1190 (top row) and DW_1227 (bottom row). (A1–2) Optical coherence tomography line scans show hyperreflective foci (arrows) in the ONL. (B1–2) En face OCT images of the ONL show hyperreflective foci within that layer. The vertical lines indicate the location of the OCT line scans (A1–2). (C1–2) Enlarged en face OCT images corresponding to the location of the rectangles in (B1–2). (D1–2) Confocal AOSLO at the location of (C1–2) shows type-2 hyperreflective clusters (D1) or the corresponding dark areas in the photoreceptor mosaic (D2), depending on the level of focus. Scale bars: 150 μm (A1–2) and 50 μm (C1–2, D1–2).

