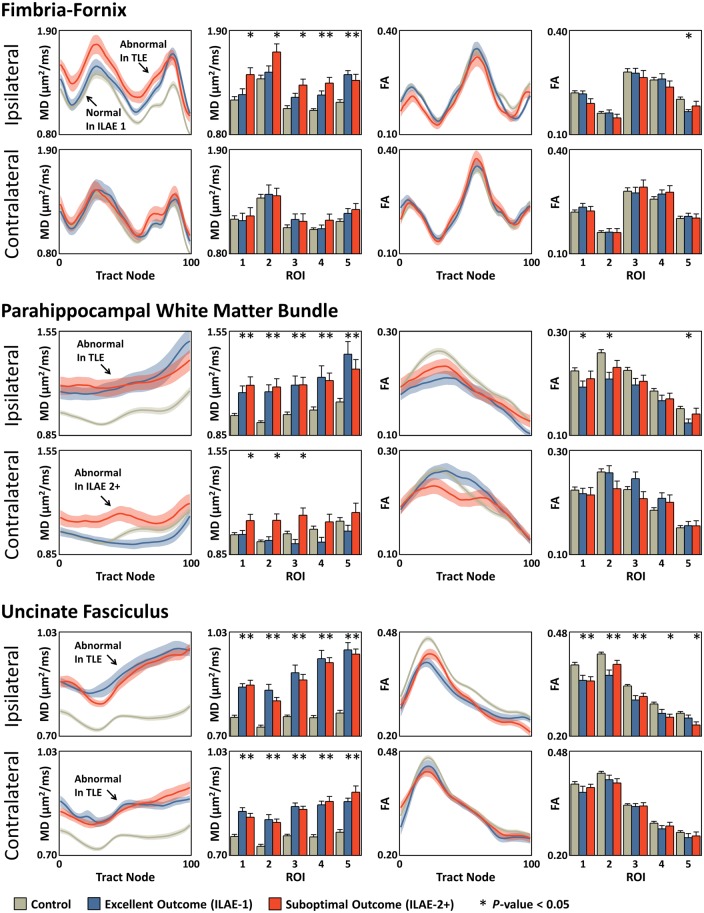
Figure 2.
Mean diffusivity (MD) and fractional anisotropy (FA) tract profiles for mean (± SEM) ipsilateral and contralateral tracts in the ILAE 1 and ILAE 2+ groups relative to controls. The histograms indicate the average tract profile over a given region of interest. In all cases, increasing tract section corresponds to increasing region of interest number and the regions of interest correspond to those given in Fig. 1. *P-value < 0.05 compared to controls after correcting for multiple comparisons with the FDR procedure. Arrows highlight statistically significantly different regions in the mean diffusivity tract profiles.

