
Figure 3.
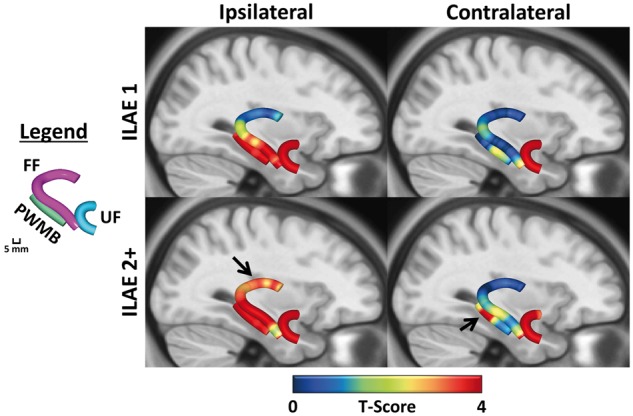
Section-wise t-scores for mean diffusivity tract profiles. Differences between patient groups and controls are shown projected onto an anatomical template to illustrate the localization of alterations in Fig. 2. Red areas represent significantly increased mean diffusivity in respective patient groups relative to controls. Arrows indicate regions significantly different only in patients with a suboptimal outcome. FF = fimbria-fornix; PWMB = parahippocampal white matter bundle; UF = uncinate fasciculus.