Figure 6.
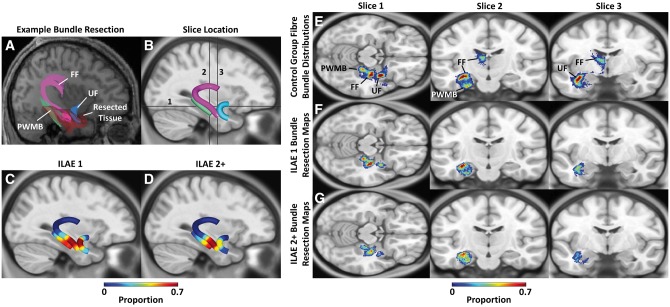
Fibre bundle resection analysis. (A) Representative tractography data and resection volume overlaid on an individual patient’s T1-weighted image illustrate the fibre bundles of interest overlapping with the resected tissue volume in circumscribed regions along each tract. (B) Group-wise representation of fibre pathways of interest overlaid on a template image. (C and D) Section-wise representation of the extent of resected fibre bundles for the ILAE 1 and ILAE 2+ groups, respectively, indicate the region of these tracts typically resected. (E) Representative slices for the fibre bundle distributions of the reconstructed tracts in the control group illustrate the anatomical location of the fibre bundles of interest. (F and G) Fibre bundle resection maps for the ILAE 1 and ILAE 2+ groups, respectively illustrate the proportion of the fibre bundles resected. The location of the representative transverse and coronal slices are given by the black bars in B. FF = fimbria-fornix; PWMB = parahippocampal white matter bundle; UF = uncinate fasciculus.

