Figure 1:
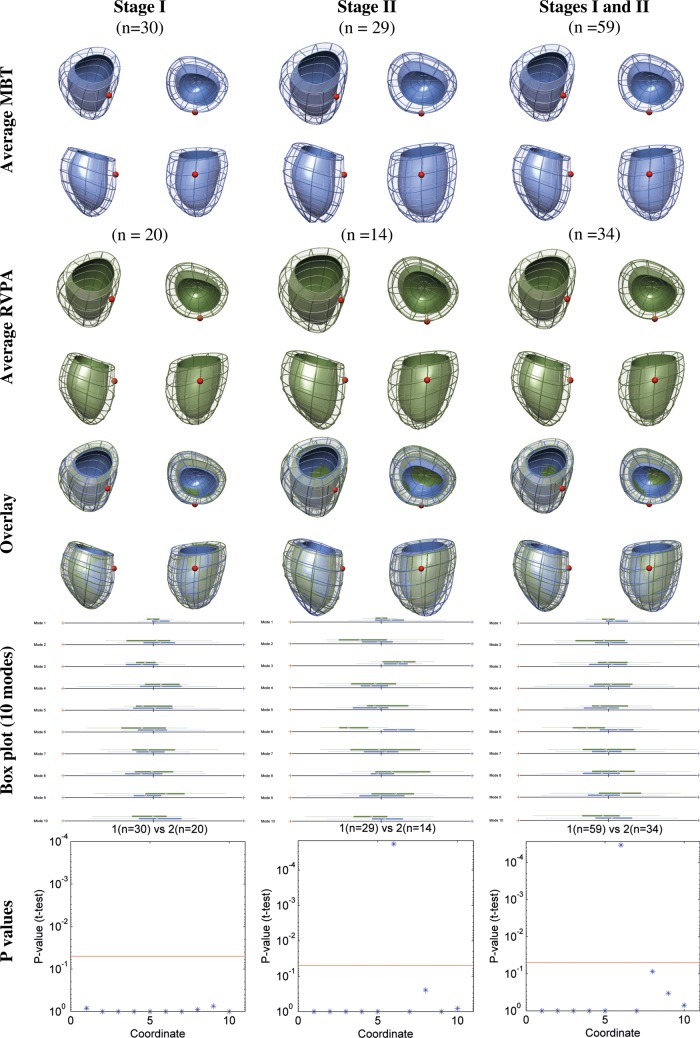
Ventricular shape differences between the RVPA conduit and MBT shunt groups. The top row shows the average ventricular shape for MBT shunts at each surgical stage and then an overall ventricular shape for both stages. The second row shows the equivalent average ventricular shape for RVPA conduits. The third row shows an overlay of the two averaged shapes for the MBT shunt and RVPA conduit groups. The solid colour represents the endocardial surface, while the mesh represents the epicardial surface. The position of the LV remnant is marked with a red sphere. Box plots for each of the first 10 cardiac atlases (Modes) are shown in the fourth row, with their corresponding P-values in the fifth row, showing a significant difference in shape in Mode 6 occurring only at stage II (P-values after Bonferroni correction; red line indicates the P = 0.05 threshold of significance). RVPA: right ventricle-to-pulmonary artery; MBT: modified Blalock–Taussig; LV: left ventricle.

