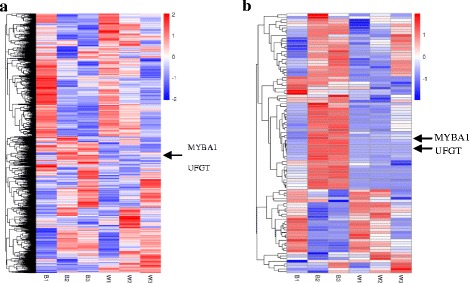
Fig. 6.

The heatmap of the differential expression genes. a The heatmap of all the differential expression genes. b The heatmap of the selected 100 differential expression genes. Using log10(RPKM + 1) value to cluster, the red color referred to high expressed genes, the blue color refer to low expressed genes. From blue to red, refer to the log10(RPKM + 1) value gradually rised up. The vertical axis refer to the genes showed similar expressed pattern were clustered in a group
