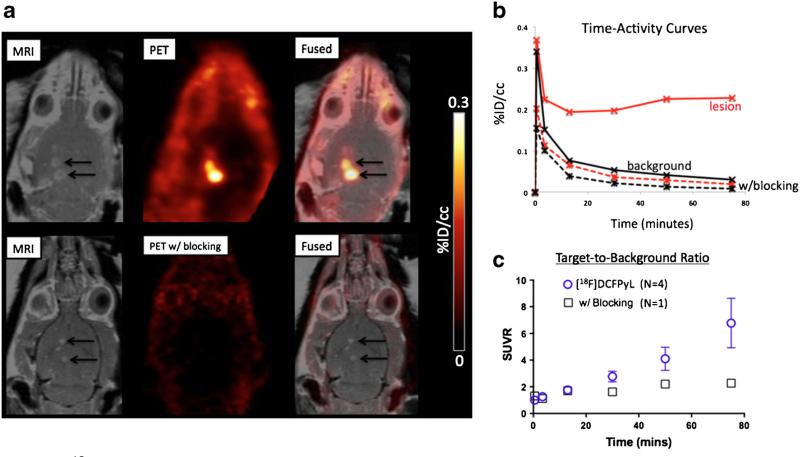
Fig. 2.
Delivery of [18F]DCFPyL to the CNS. a Coronal T1-weighted post-contrast MRI (left), PET (middle), and PET-MRI overlay (right) demonstrate delivery of [18F]DCFPyL alone (top row) or with ZJ-43 (bottom row), a competitor for GCPII binding, to the targets of BBB opening. b Time-activity curves for PET-CT imaging of [18F]DCFPyL alone (solid curves) or with the blocking agent ZJ-43 (dashed curves) delivered to BBB opening targets (red curves) vs. background regions of interest (black curves). c SUV ratios (SUVR) of target to background vs. time for PET-CT imaging following MRgFUS BBB opening and administration of [18F]DCFPyL alone (blue circles; presented as mean ± standard deviation) or with the blocking agent ZJ-43 (black squares) (Color figure online).

