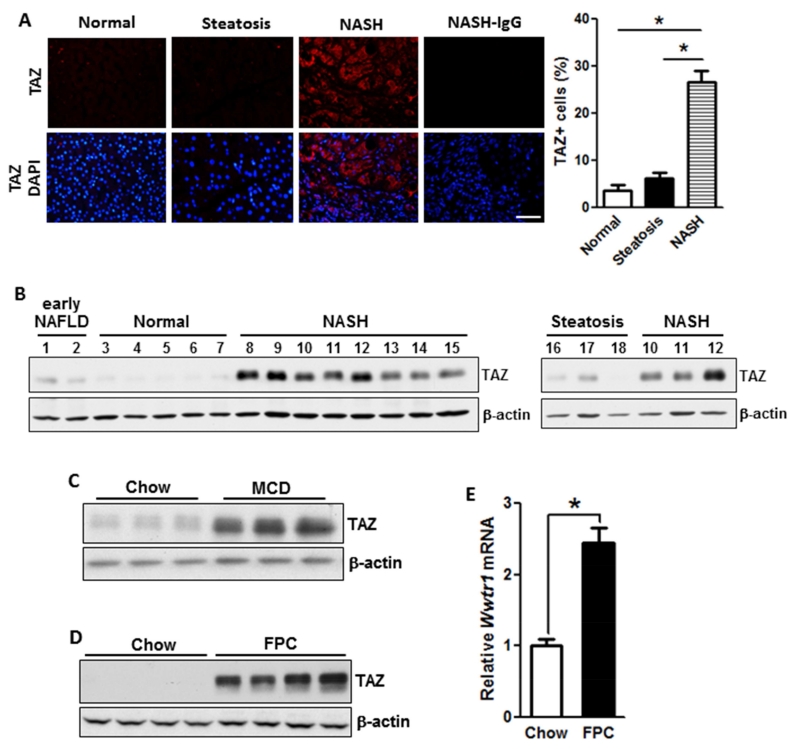
Figure 1. TAZ Levels are Increased in the Livers of Humans and Mice with NASH.
(A) TAZ immunofluorescence (red) in normal, steatotic, and NASH human liver sections; DAPI counterstain for nuclei is shown in bottom panels. NASH-IgG refers to control for primary antibody. Bar, 100 μm. The data were quantified as percent TAZ+ cells relative to total liver cells (*p < 0.0001; mean ± SEM; n=7 specimens/group).
(B) Immunoblots of TAZ in early NAFLD, normal, NASH, and steatotic human liver. For sake of comparison, samples #10-12 of NASH from the left blot were re-run with the steatosis samples in the right blot. β-actin was used as loading control.
(C) Immunoblot of liver TAZ in mice fed chow or MCD diet, with β-actin as loading control.
(D) Immunoblot of liver TAZ in mice fed chow or FPC diet, with β-actin as loading control.
(E) Quantification of Wwtr1 (Taz) mRNA in livers from mice fed chow or FPC diet (*p < 0.0001; mean ± SEM; n=6 mice/group)

