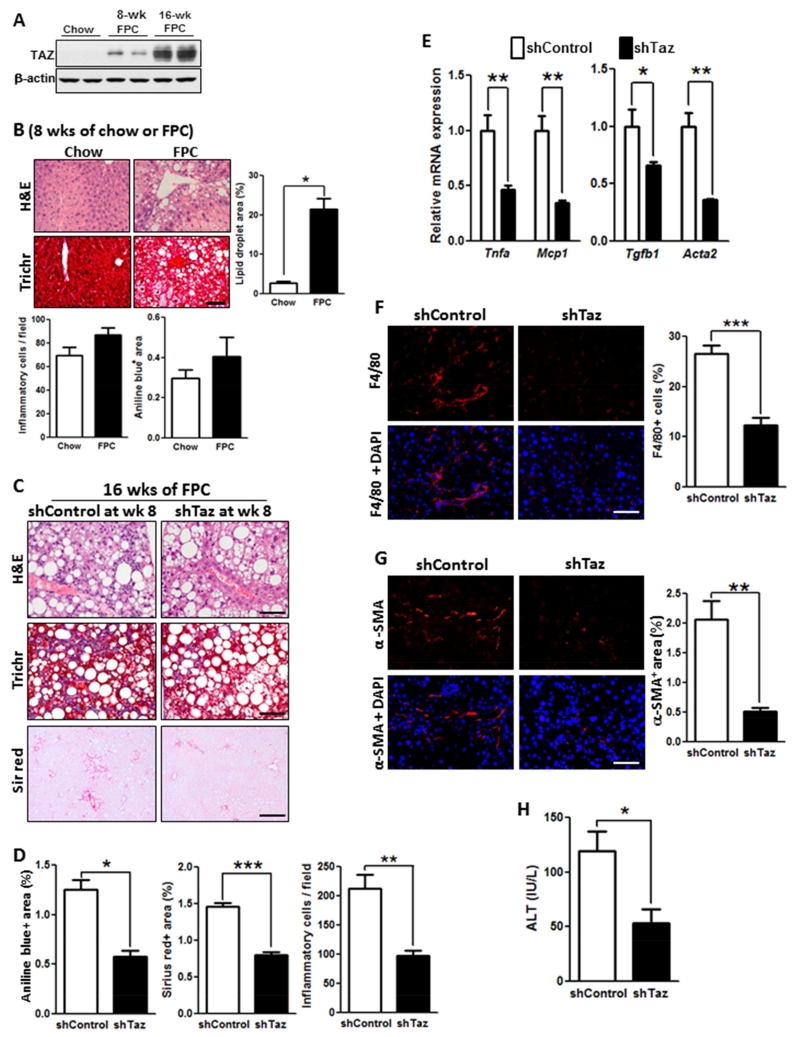
Figure 4. TAZ Silencing After the Development of Steatosis Reduces Liver Inflammation and Fibrosis in FPC-Fed Mice.
(A) TAZ immunoblot of liver extracts from C57BL/6J mice fed chow or FPC diet for 8 or 16 weeks.
(B) H&E- and Masson’s trichrome (Trich)-stained liver sections and quantified lipid droplet area, inflammatory cells, and aniline blue-positive area for C57BL/6J mice fed chow or FPC diet for 8 weeks. Bar, 100 μm.
(C-H) The following parameters were measured in male C57BL/6J mice fed the FPC diet for 16 weeks, with AAV8-H1-shTaz or control vector administered at the 8-week time point (*p < 0.05; **p < 0.01, ***p < 0.0001, mean ± SEM; n=5 mice/group):
(C) Staining of liver sections for H&E (upper panels; Bar, 100 μm), Masson’s trichrome (Trichr) (middle panels; Bar, 100 μm), and Sirius red (Sir red) (lower panels; Bar, 500 μm).
(D) Aniline blue- and Sirius red-positive area and hepatic inflammatory cells.
(E) mRNA levels of Tnfa, Mcp1, Tgfb1, and Acta2 (α-SMA).
(F) F4/80 immunofluorescence (red) and quantification; DAPI counterstain for nuclei is shown in bottom panels; Bar, 100 μm.
(G) α-SMA immunofluorescence (red) and quantification; DAPI counterstain for nuclei is shown in bottom panels; Bar, 100 μm.
(H) Plasma ALT.

