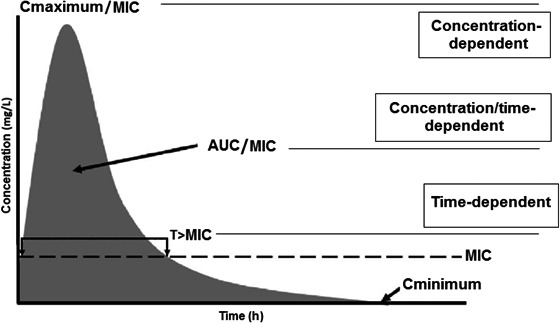
Figure 1.

Pharmacodynamics of an antimicrobial drug with respect to its concentration versus time curve. T > MIC: time (T) that the drug concentration remains above the minimum inhibitory concentration (MIC); Cmaximum/MIC: maximum concentration rate (Cmaximum) by the MIC; AUC/MIC: ratio of the area under the curve (AUC) of the concentration versus time above the MIC. Adapted from Roberts and Lipman (2009).
