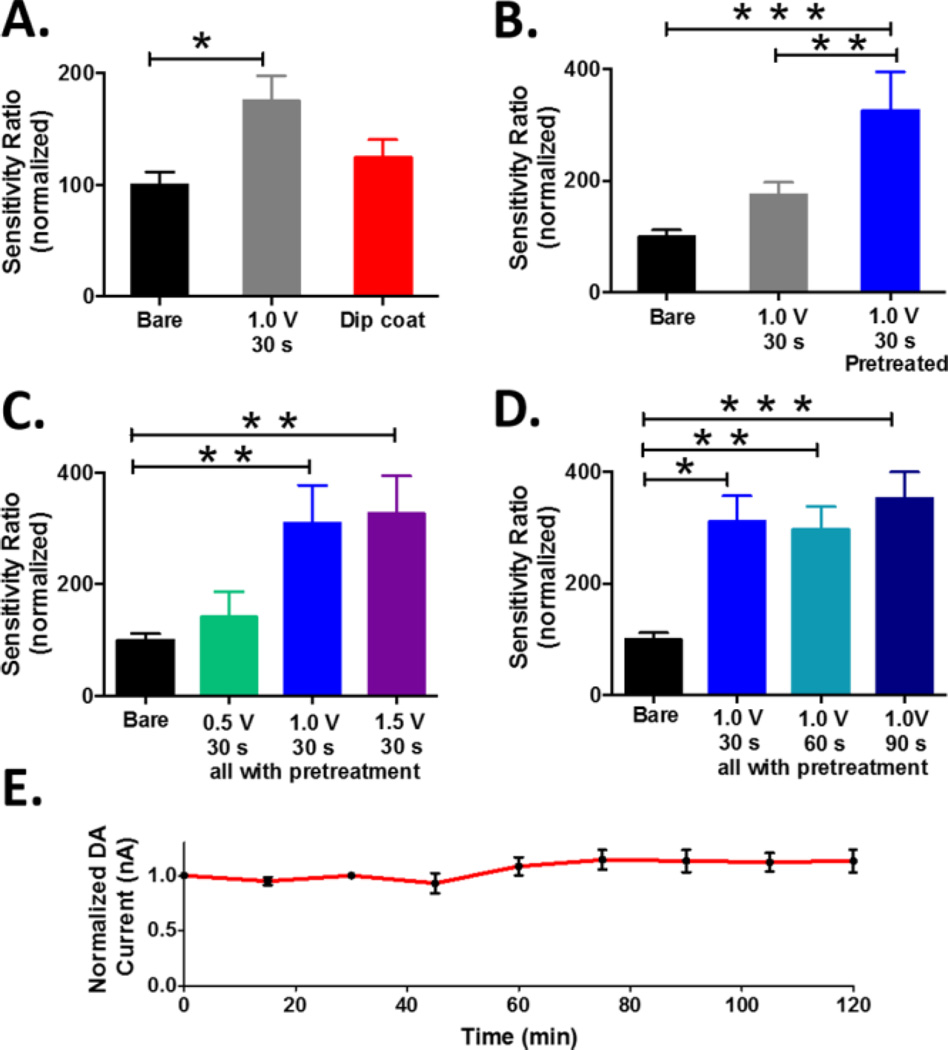
Figure 4.
Systematic characterization of Nafion coating procedures. (A) Dip coating versus electrodeposition (F(2,40)=4.76, * p<0.05), (B) Electrochemical pretreatment before (blue) vs. after (gray) Nafion electrodeposition (F(2,36)=12.20, **p<0.01, ***p<0.001), (C) Electrodeposition potentials (F(3,33)=7.78, **p<0.01), (D) Electrodeposition times (F(3,51)=8.30, *p<0.05, **p<0.01, ***p<0.001), (E) Stability of coated electrodes. In panels A-D, data are presented as normalized DA sensitivity ratio (n = 6–17 electrodes per protocol, one way ANOVA with Tukey’s post-hoc test, * p<0.05; ** p< 0.01; *** p<0.001).

