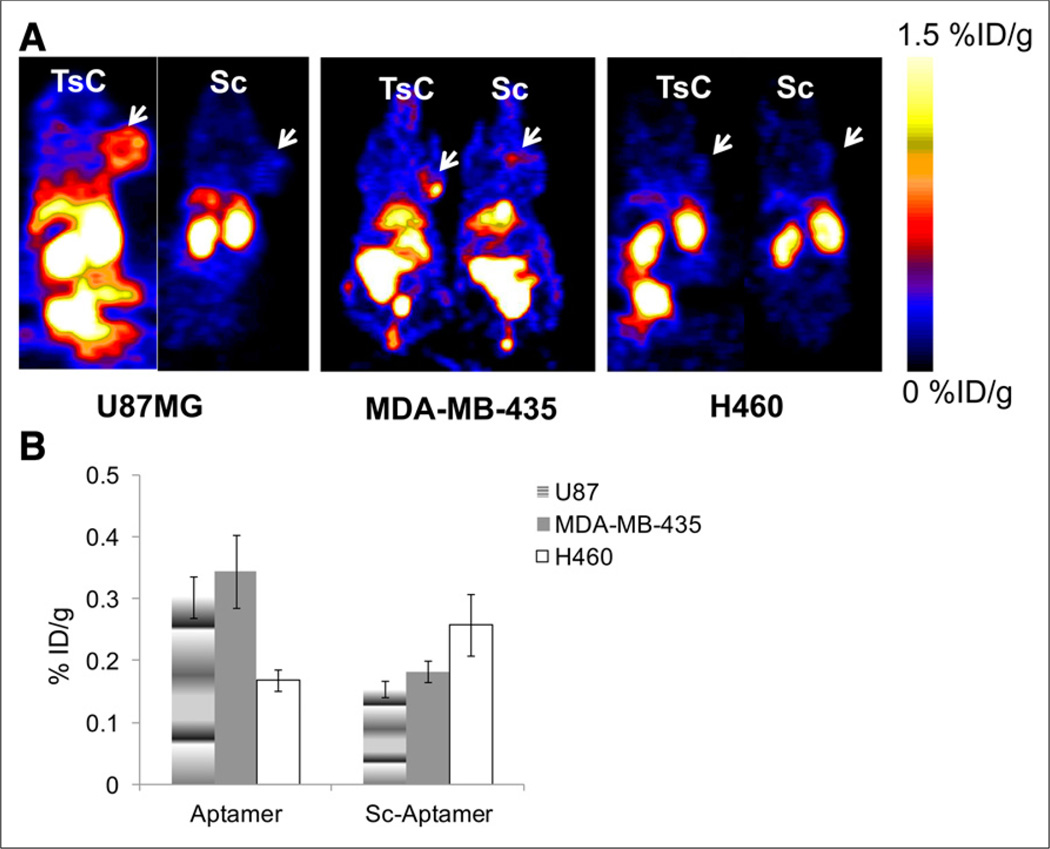
FIGURE 6.
(A) Representative coronal PET images of 64Cu-NOTA-tenascin-C aptamer and 64Cu-NOTA-Sc aptamer in different tumor models (tenascin-C–positive [U87MG and MDA-MB-435] and tenascin-C–negative [H460]) at 6 h after injection. White arrows represent tumor location. (B) Quantified results of tumor uptake of both tracers, calculated from PET images at 6 h after injection (n = 5/group). TsC = tenascin-C.

