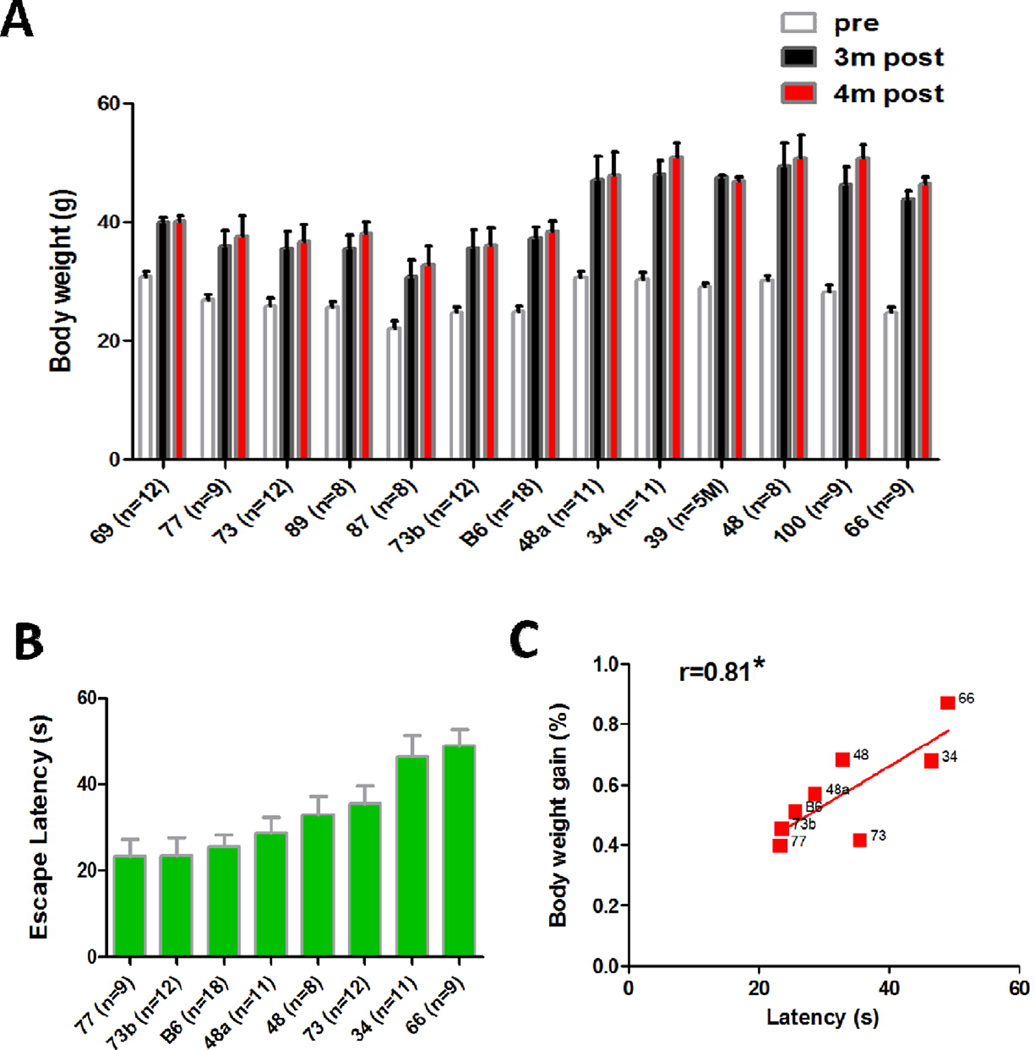
Figure 2. Correlation between water-maze performance and body weight gain in BXD RI strains after 4-month HFD treatment.
(A) Comparison of the body weight of high fat diet induced-obesity mice after 4 months of consumption. Data are represented as mean ± SEM from each time-point (i.e. 0, 3 or 4 months of diets). Strains are arranged from smallest to largest body weight gain (left to right). (B) The average escape latency (error bar represents SEM, n=8–18/group) is shown for each BXD RI strain and the parent C57BL/6 strain. (C) A strong correlation exists between the percentage of body weight gain and the average escape latency in B BXD strains after 4 months of HFD consumption. The number next to each data point refers to the BXD strain number (P<0.05, r=0.81).

