
Figure 2. K3-SPG the tumor microenvironment.
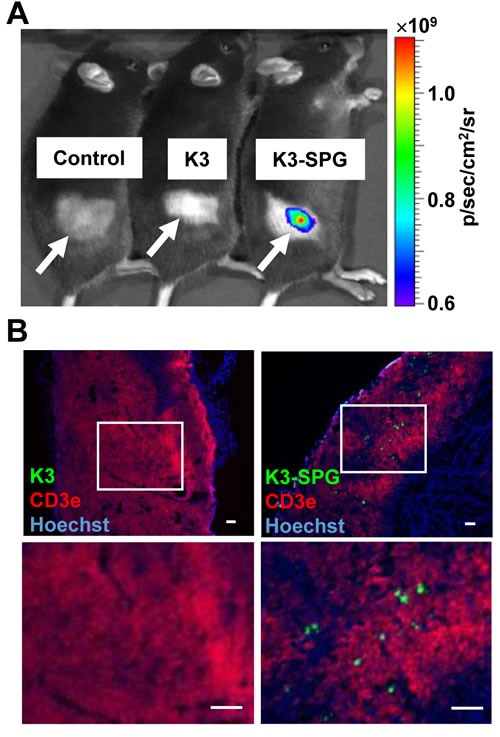
A. Mice were inoculated s.c. with EG7 and were administrated with PBS, Alexa647-K3 i.v. or Alexa647-K3-SPG, at day 12. One hour after administration, mice were analyzed by IVIS, in which images measured in relative fluorescence were converted into physical units of surface radiance (photons/sec/cm2/sr). White arrows indicate tumor-inoculated areas. B. Frozen sections of tumor were stained by anti-CD3e antibody (red, EG7 staining) and Hoechst 33258 (blue, nucleus staining) and analyzed by fluorescent microscopy (scale bars, 100 μm).