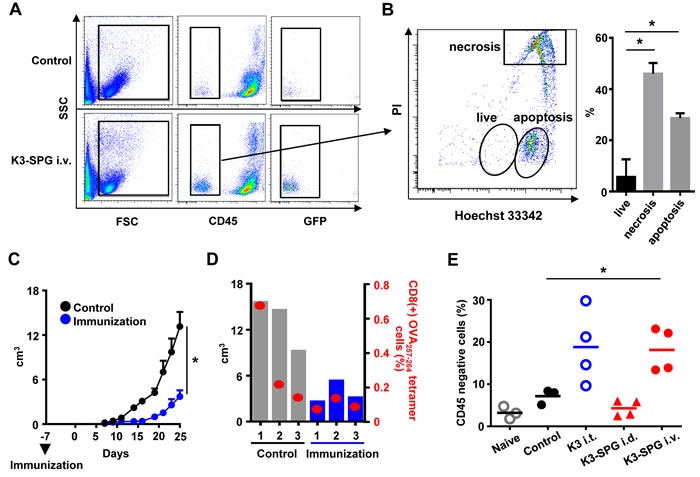
Figure 4. K3-SPG induces immunogenic cell death, which is essential for tumor regression.

A. GFP mice were inoculated s.c. with EG7, treated i.v. with PBS or K3-SPG at days 7, 9, and 11, and were sacrificed at day 12. Splenocytes were collected and stained by anti-CD45 antibody and cells were analyzed by flow cytometry. B. CD45- populations were stained by Hoechst 33342 and propidium iodide (PI) for dead cell staining and analyzed by flow cytometry. Bar graphs indicate the population of apoptotic, necrotic, and live CD45- cells. Error bars represent mean + SEM (n = 3). *p < 0.05 (t-test). C. Mice were immunized with or without CD45- cells. Seven days after immunization, mice were inoculated with EG7 s.c., and the size of tumors were measured (n = 3). Error bars represent mean + SEM. *p < 0.05 (t-test). D. Tumor volume and OVA257-264 specific tetramer positive CD8 T-cell numbers are represented by bar and scatter graphs, respectively, at day 25. *p < 0.05 (t-test). E. Mice were inoculated with EG7 s.c. and were treated with PBS, or K3-SPG i.v. or K3 i.t., or K3-SPG intradermally on same schedule as (A Splenocytes were collected and stained by anti-CD45 antibody and analyzed by flow cytometry. Scatter plots indicate CD45- cell populations. *p < 0.05 (t-test).
