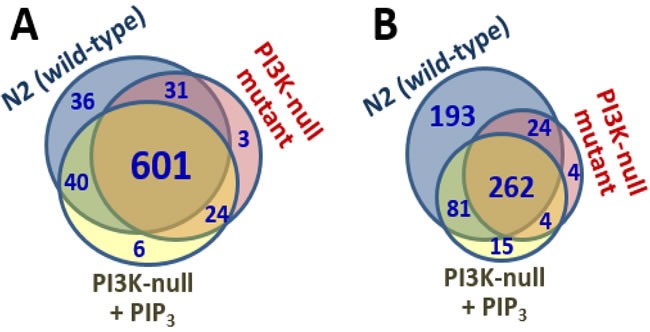
Figure 3. Venn diagrams.

Indicate numbers of proteins positively identified in each membrane fraction (A), or in the subset of those proteins that bound PIP3>>PIP2 (B).

Indicate numbers of proteins positively identified in each membrane fraction (A), or in the subset of those proteins that bound PIP3>>PIP2 (B).