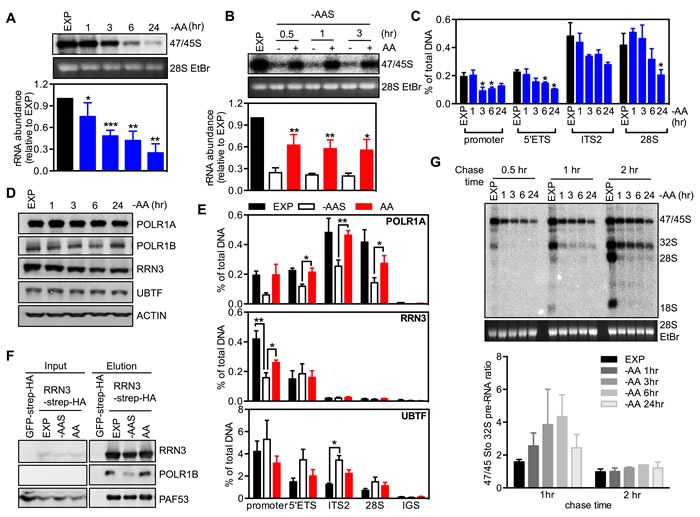
Figure 1. Amino acids regulate rRNA synthesis at multiple steps.

A. Exponentially growing HeLa cells (EXP) were starved of all amino acids (-AA) for times indicated. Cells were pulse labeled and 47S/45S rRNA synthesis analyzed. Representative images and resultant graph (mean +/− SEM) from n = 3-5 experiments. B. HeLa cells were starved in amino acid and serum starvation medium (-AAS) for 2 hours, then re-stimulated with all amino acids (AA) for the times indicated. Cells were pulse labeled and 47/45S rRNA synthesis analyzed. Representative images and resultant graph (mean +/− SEM) from n = 4 experiments. C.-D. HeLa cells were treated as in A. C. qChIP analysis assess Pol I loading on various regions of the rDNA. n = 3 experiments. * p < 0.05 compared to EXP cells. D. Immunoblotting with the indicated antibodies. Representative of n = 3 experiments. E. HeLa cells were starved of amino acid and serum (-AAS) for 2 hours, then re-stimulated with amino acids (AA) for 3 hours. qChIP analysis to assess POLR1A, RRN3 and UBTF loading on various regions of the rDNA. n = 3-4 experiments. F. HEK293 cells were treated as in E. Western blot analysis of immunoprecipitated ectopically expressed TAP-tagged RRN3 for endogenous POLR1B, and PAF53 in HEK293 cells. Representative of n = 3 experiments. G. HeLa cells were treated as in A. Cells were pulse labeled, chased for different time pointed as indicated and rRNA processing determined. Representative images and resultant graph (mean +/− SD) of n = 2 experiments. * p < 0.05, ** p < 0.01, ***p < 0.001 A. and C. compared to EXP cells B. compared to -AAS cells.
