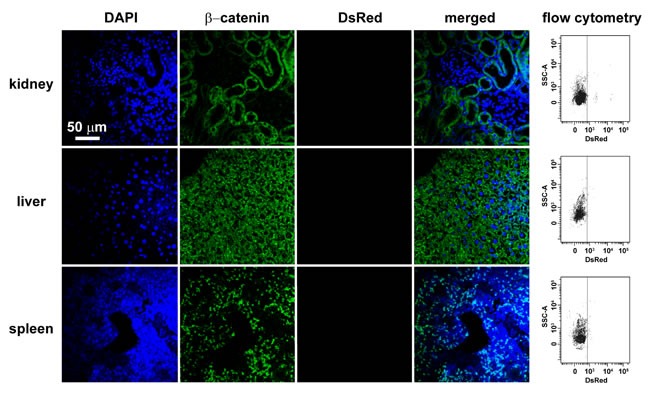
Figure 4. The localization of small amount of mitochondria in kidney, liver and spleen after intravenous injection.

Immunohistochemical stainings of kidney, liver and spleen in rats after intravenous injection of DsRed-labeled mitochondria showing DAPI (blue), β-catenin as a cell membrane marker (green), DsRed (red), or overlap of the above three and light field. Each organ was cut through an incision along the midline of sagittal plane and two separate sections were sampled at the hilus and periphery region adjacent to capsule for each organ, respectively. All the fields of each section were examined under fluorescent microscope. Shown are representative stainings of 4-5 separate fields photographed randomly from each sliced sections of two individual rats for each organ. Also shown for each organ are the representative flow cytometry for the separation of DsRed-labeled exogenous mitochondria from kidney, liver and spleen, respectively. The mitochondria isolated from rats without mitochondrial injection were used as a negative control to set up voltages of side scatter (SSC) for flow cytometry analysis.
