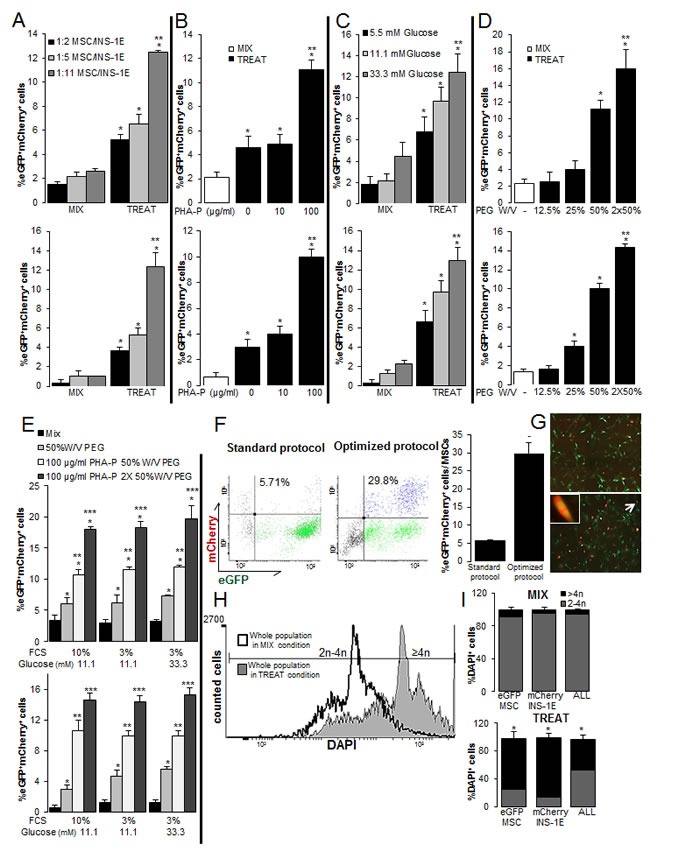
Figure 2. Optimization of the PEG-mediated cell fusion for rat-human β-MSC heterokaryons.

(A-E) The percentages of MSC/INS-1E cells measured by eGFP+mCherry+ flow cytometry (top) as well as quantitative fluorescent microscopic analysis (bottom) in MIX and TREAT conditions after puromycin selection of all cells in culture. (A) The mixture of the 1:2 ratio of MSC/INS-1E cells (standard protocol), 1:5 or 1:11 in mixed cells (MIX) and 50%W/V PEG and 100 μg/ml PHA-P treated cells at 11.1 mM glucose as the control glucose concentration for INS-1E cells. (B-E) MSC/INS-1E cells at a ratio of 1:11. (B) 50%W/V PEG treated cells were exposed to 0, 10 and 100 μg/ml PHA-P. (C) 50%W/V PEG and 100 μg/ml PHA-P treated and untreated mixed cells were pre-incubated for 8 h with 5.5, 11.1 or 33.3 mM glucose. (D) 100 μg/ml PHA-P treated were exposed to 12.5, 25 and 50% W/V or twice 50% W/V PEG. (E) 1X or 2X 50%W/V PEG and 100 μg/ml PHA-P treated cells and mixed cells were pre-incubated with media including 10% FCS, 3% FCS or 3% FCS/ 33.3 mM glucose. (F, G) Comparison of the number of eGFP+mCherry+ MSCs to all MSCs between standard and optimized protocol (1:11 MSC/INS-1E; 2×50%W/V PEG and 100 μg/ml PHA-P) by flow cytometry analysis of mCherry and eGFP (F) and by fluorescence microscopy (G; 40X; right). Arrow bar shows an eGFP+mCherry+ MSC in higher magnification (400X). The difference in A-E and F is in the normalization strategy; while results in A-E are normalized to all cells in culture, in F they were normalized to all MSCs. (H, I) Polyploidy analysis by FACS before puromycin selection of mixed and treated cells (H) and quantification of polyploid cells within eGFP+MSCs or mCherry+INS-1E cells alone and the whole population (eGFP+MSCs/mCherry+INS-1E/eGFP+mCherry+β-MSC) (I). Average counted cells were 5000 events per condition. Analyses were performed in at least three independent experiments and show mean ± SEM. *P< 0.05 Treat compared to Mix at the same conditions; **P< 0.05 at the ratio of 1:11 compared to 1:5 (A), 100 compared to 10 μg/ml PHA-P (B), 33.3 compared to 5.5 mM glucose (C), 2X compared to 1X 50% W/V PEG (D), PHA-P/PEG compared to PEG alone, ***P<0.05 2x compared to 1x 50% W/V PEG at the same conditions, −P< 0.05 optimized compared to standard protocol;
