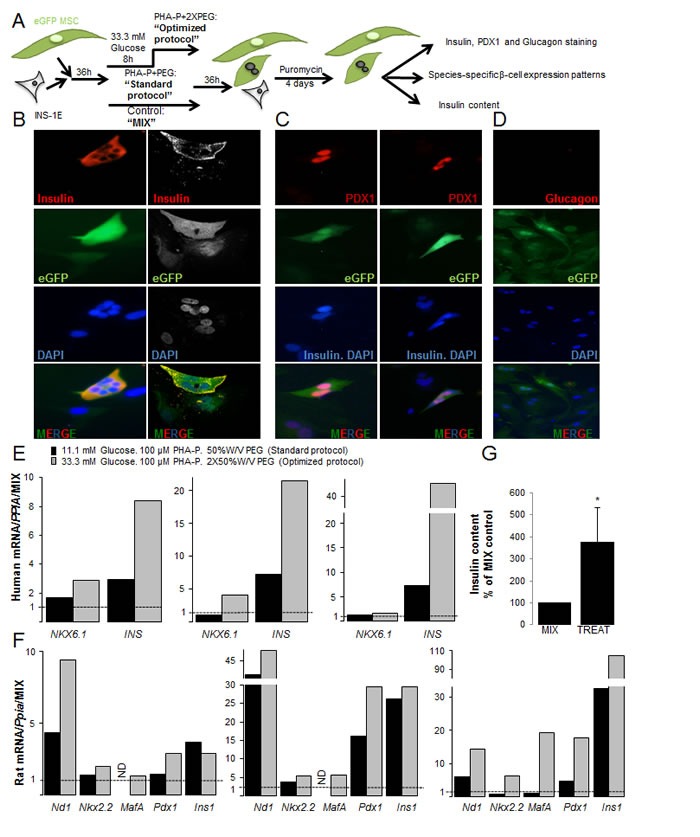
Figure 3. Characterization of insulin+human/rat β-MSC heterokaryon cells.

(A) Schematic illustration of the strategy for generation of fused human eGFP+MSCs/rat mCherry+INS-1E cells and their subsequent analysis. (B-G) eGFP+MSCs and mCherry+INS-1E cells were treated with PHA-P and PEG, 4 days after puromycin selection. (B) Triple labeling for insulin, eGFP and DAPI revealed polyploid insulin+eGFP+β-MSCs by fluorescence microscopy (left) or CLSM (right). (C) Triple staining for PDX1, DAPI and insulin shows PDX1+eGFP+insulin− polyploid (left) as well as PDX1+eGFP+insulin+ polyploid cells (right; all 400X). (D) All cells were glucagon−, (200X). (E, F) RT-PCR analysis of human (E) and rat (F) specific mRNA sequences of β-cell markers shown from three independent experiments relative to mixed MSC/INS-1E cells and normalized to human (E) or rat Cyclophilin A (F). (G) Insulin content from mixed and treated cells under the optimized condition normalized to protein concentration and shown as percentage of mixed cells. All analyses are from at least three independent experiments from three different MSC donors shown in separate graphs (E, F) or as means ± SEM (G). ND = not detected. *P< 0.05 TREAT compared to MIX.
