
Figure 5. Effect of IRF3 on immune inflammatory responses in KCs.
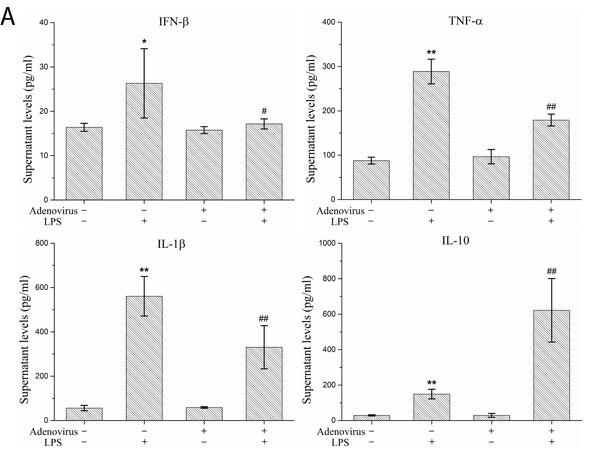
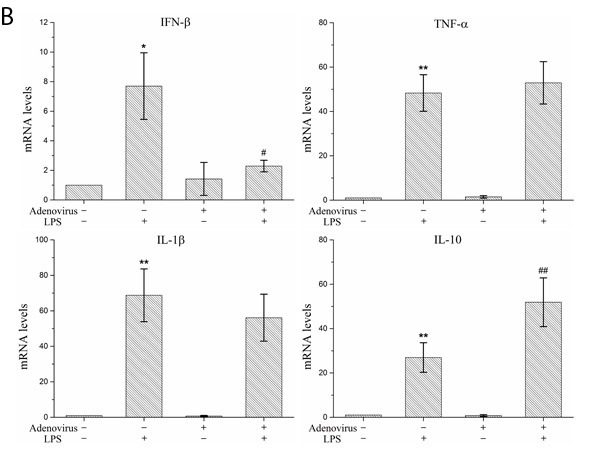
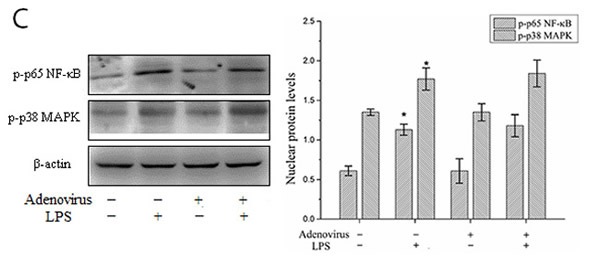
KCs were infected with IRF3 shRNA adenovirus 48 h before LPS stimulation. A. Secretion levels of IFN-β, TNF-α, IL-1β and IL-10 in KCs. Culture supernatant were assayed for IFN-β, TNF-α, IL-1β and IL-10 via ELISA. Data represent means ± SD (n = 6). B. mRNA expression of IFN-β, TNF-α, IL-1β and IL-10 in KCs using real-time PCR. Relative expression levels of IFN-β, TNF-α, IL-1β and IL-10 mRNA were detected in KCs after normalization to GAPDH through real-time PCR. Data represent means ± SD (n = 6). C. p-p65 and p-p38 MAPK protein expressions in the nuclear of KCs using Western blot. Left panel shows representative pictures of Western blot, and right shows relative levels of nuclear p-p65 and p-p38 MAPK protein after normalization to β-actin. Data represent means ± SD (n = 6). *P<0.05 and **P<0.01 versus control cells [adenovirus(-)LPS(-)]; #P<0.05 and ##P<0.01 versus LPS-stimulated cells [adenovirus(-)LPS(+)].