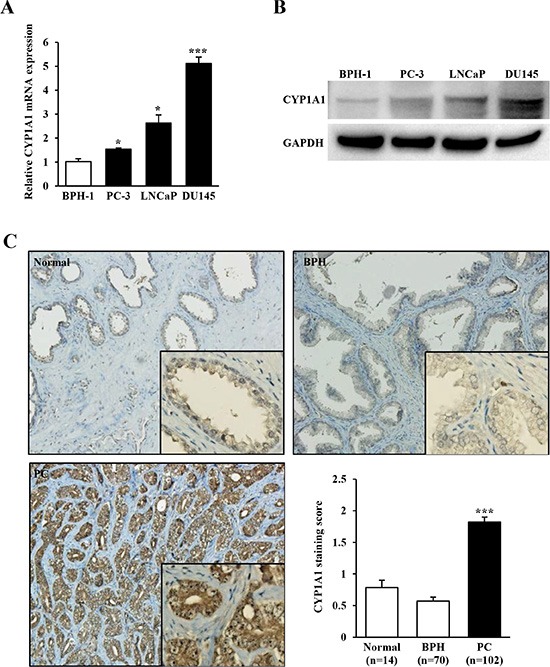
Figure 1. CYP1A1 expression in prostate cancer cell lines and tissues.

(A) Relative mRNA expression levels of CYP1A1 in prostate cancer cell lines (PC-3, LNCaP, and DU145) and benign cells (BPH-1) as measured by real-time PCR. The expression level of CYP1A1 mRNA was significantly up-regulated in prostate cancer cell lines. Experiments done in triplicate; *P < 0.05, ***P < 0.001. (B) Representative immunoblot displaying CYP1A1 (top gel) and GAPDH (bottom gel) in BPH-1, PC-3, LNCaP and DU145. (C) Representative immunostaining of CYP1A1 in clinical samples (normal prostate, benign prostatic hyperplasia (BPH), and prostate cancer (PC) obtained from tissue microarray. Bar graph: CYP1A1 protein expression in prostate cancer (n = 102) samples was significantly higher than that of normal (n = 14) or BPH (n = 70) tissues. ***P < 0.001.
