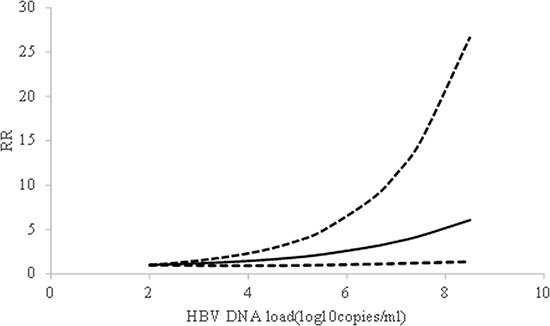
Figure 3. The shape of association between HBV DNA level and HCC risk, with restricted cubic splines in random-effects dose-response model.

The solid line and the short dash line represent the estimated relative risks and corresponding 95% CIs, respectively.
