
Figure 6. ESCC tissues exhibit enhanced genomic alterations of V-ATPase V1E1 and gene signatures related to cancer metabolism.
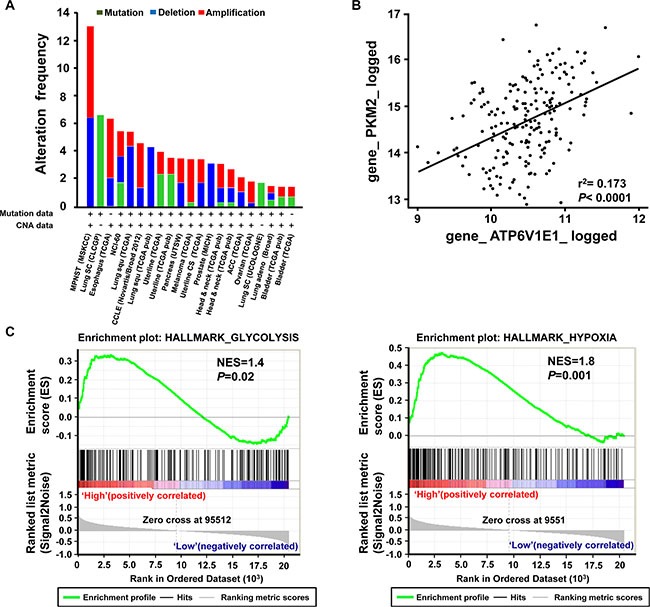
(A) Frequency of copy number alterations and mutations of V-ATPase V1E1 across several tumor types. (B) Correlation between V1E1 and PKM2 mRNA expression levels in ESCC (n = 1176). (A, B) The results shown here are based upon data generated by the TCGA Research Network (Available online: http://cancergenome.nih.gov/). (C) GSEA analysis on expression data set from V1E1-positive (n = 11) and V1E1-negative (n = 8). ESCC tissues showing enriched gene sets related to cancer metabolism. Normalized Enrichment Scores (NES) and P values are presented.