
Figure 3. CCL2 gene silencing inhibits primary and secondary invasion of MDA-MB-231 breast tumors.
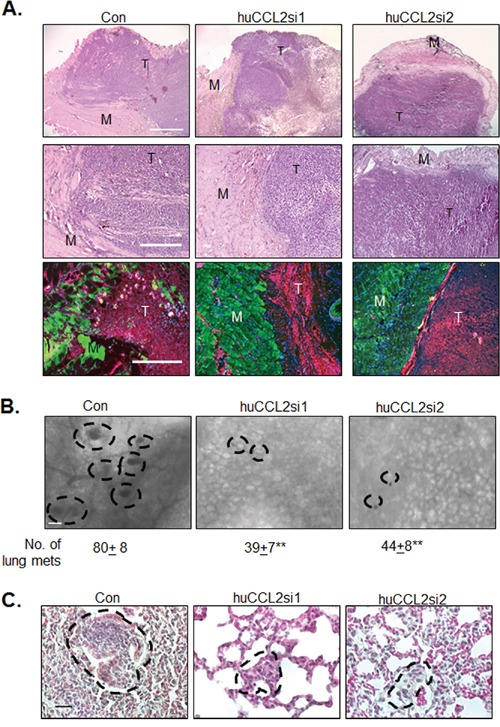
A. Top panels: Low magnification (4X) H&E stain with muscle tissue (M) and tumor tissue (T). Scale bar=1000 microns. Middle panels: Higher magnification (10x) H&E stain with muscle tissue and tumor tissue. Scale bar=400 microns. Bottom panels: CO-IF stain of Calsquestrin (green) and CK5 (red) in primary tumor xenografts. Overlays of Calsequestrin, CK5 and DAPI stain are shown. Scale bar= 400 microns. B. Metastatic lesions throughout the lung tissue were visually identified by hematoxylin staining as round shaped nodules using an inverted microscope and quantified. Representative images are shown. Metastatic nodules are outlined. Scale bar=80 microns. C. H&E stain of lung tissues. Metastatic lesions are circled. Scale bar=40 microns. Statistical analysis was performed by One way ANOVA followed by Bonferonni post-hoc comparisons with Control siRNA group (Con). Statistical significance was determined by p-value less than 0.05. **p<0.01. Mean+SEM is shown. N=6 animals per group.