
Figure 5. Gossypol inhibits NSCLC cell growth by decreasing ATP production.
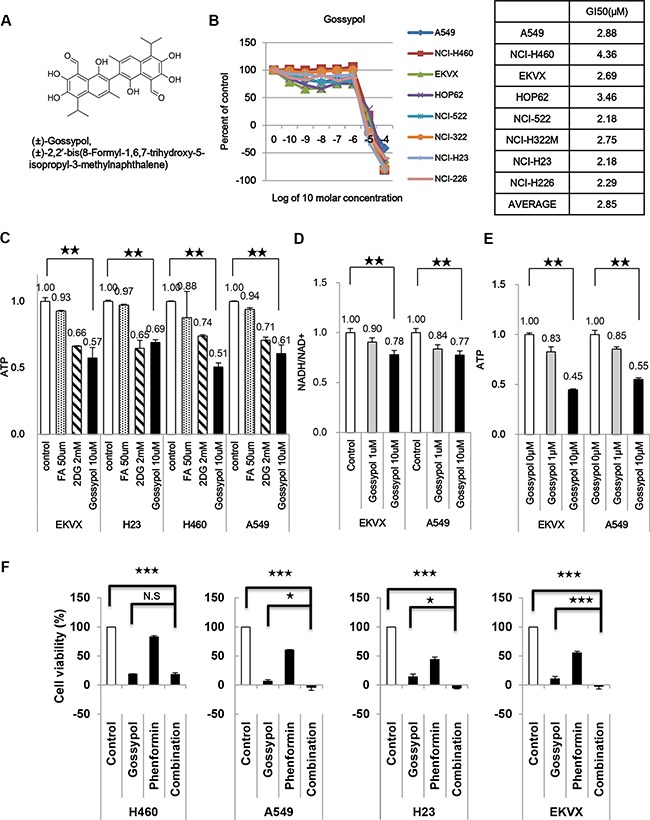
(A) Structure of gossypol. MW = 518.563. (B) Effect of gossypol on NSCLC cell proliferation as determined by the SRB assay. (C) Cells were treated with the indicated inhibitors and then the level of ATP was determined. (D, E) The levels of NADH/NAD+ (D) and ATP (E) were measured after EKVX and A549 cells were treated with 1 and 10 μM gossypol for 24 h. (F) Combined treatment of 10 μM of gossypol with 100 μM phenformin showed synergistic inhibition of cell growth in NSCLC, as determined by the SRB assay. Data are representative of the mean and standard deviation of three independent experiments. *p < 0.05, **p < 0.01, ***p < 0.001 compared to vehicle control.