
Figure 6. Combination of gossypol and phenformin remarkably reduced NADH and ATP production with down regulation of mitochondrial action potential.
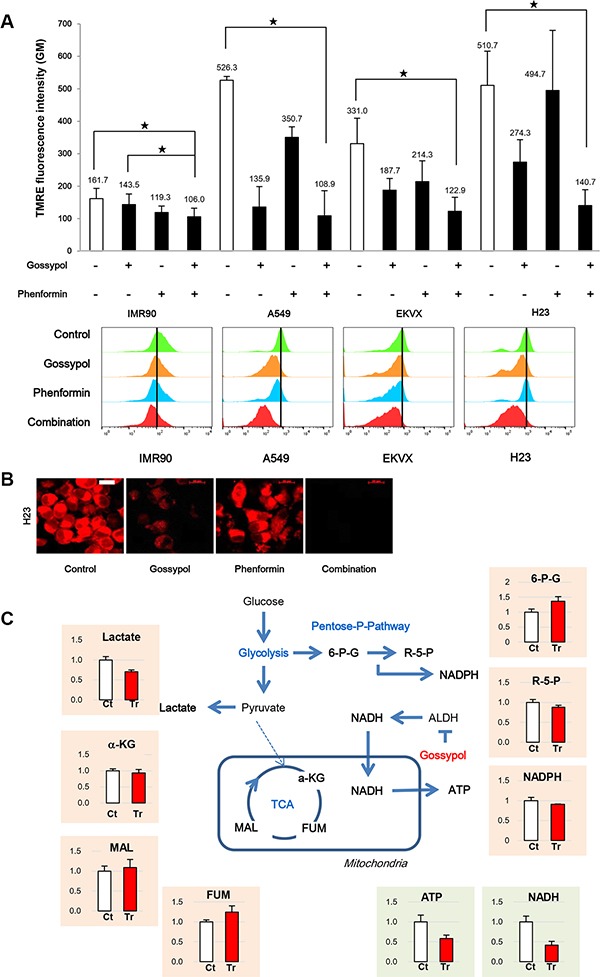
(A) Cells were treated as indicated for 24 h, stained for TMRE, and analysed by flow cytometry and live cell imaging. Data are representative of the mean and standard deviation three independent experiments. (B) H23 was stained for TMRE after 24 h treatment of gossypol, phenformin, and combination. Scale bar = 20 μm. (C) Effect of gossypol treatment on metabolites from various metabolic pathways in A549 cells. Relative pool sizes of metabolites by targeted LC-MS/MS upon gossypol treatment for 24 h. Data are representative of the mean and standard deviation three independent experiments. *p < 0.05 compared to vehicle control.