
Figure 5. ß-catenin inhibition induces cell senescence and reduces tumor growth in human tumoral thyroid cells.
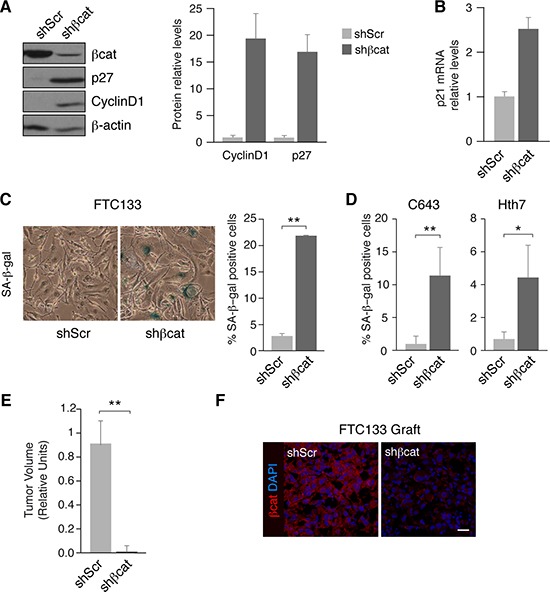
(A) FTC133 cells were infected with control (shScr) or ß-catenin (shßcat) lentivirus shRNAs. Left panel: total protein extracts were obtained and analyzed by western blot for the detection of ß-catenin, cyclinD1 and p27. Right panel: quantification of cyclinD1 and p27 protein levels normalized to β-actin. Values represent means ± SEM (n = 3). (B) p21 mRNA expression levels were analyzed in FTC133 shScr and shßcat-infected cells. (C) FTC133 cells were infected with control (shScr) or ß-catenin (shßcat) lentivirus shRNAs and analyzed for SA-ßgal-positivity. Left panel: representative ßgal-staining. Right panel: percentage of SA-ßgal positive cells per field. Values represent means ± SEM (n = 3). **p < 0.01. (D) C643 and Hth83 cells were infected with control (shScr) or ß-catenin (shßcat) lentivirus shRNAs and analyzed for SA-ßgal-positivity. Percentage of SA-ßgal positive cells per field. Values represent means ± SEM (n = 3). **p < 0.01. (E) FTC133 control (shScr) or shßcat cells were injected in NOD-SCID mice and the tumor volume was measured at the end of the experiment. Values represent means ± SEM (n = 3). **p < 0.01. (F) FTC133 grafts from control (shScr) or shßcat cells were stained with a ß-catenin antibody (red). Nuclei were stained with DAPI (blue). Scale bar 25 μm.