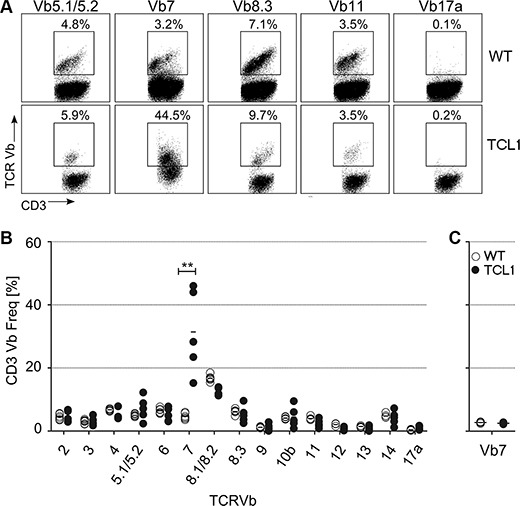
Figure 1. TCR-Vβ usage in the TCL1 CLL mouse model.

Splenocytes from sacrificed leukemic TCL1 mice and from age-matched wildtype (WT) mice were stained using CD3 and TCR-Vβ-specific antibodies. (A) Representative FACS plots for WT and TCL1 mice are shown. (B) Graph showing percentage of CD3+ T cells from leukemic mice, which are expressing the respective TCR-Vβ element (WT n = 6; TCL1 n = 5). (C) Graph showing percentage of CD3+ T cells from young preleukemic mice (age ≤ 150 days), which are expressing the TCR-Vβ7 element (n = 4). (Horizontal bars indicate mean percentage).
