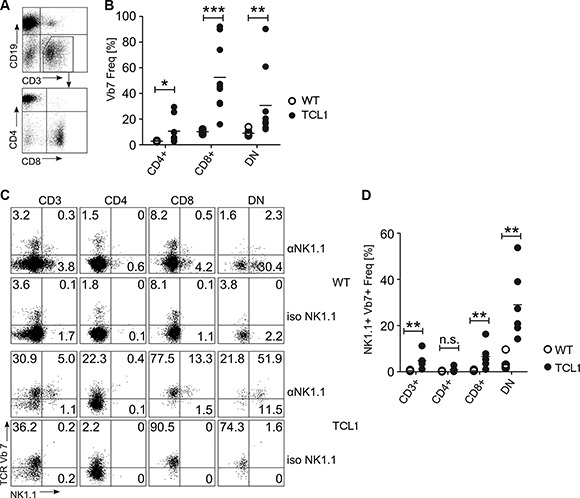
Figure 2. TCR-Vβ7 usage in T cell subsets of the TCL1 mouse.

CD3+Vβ7+ T cells from TCL1 mice were further stained for CD4 and CD8 expression (A, B) and for NK1.1 (C, D). Representative FACS profiles and graphs showing statistical analysis are shown. WT: n = 6 (B and D), TCL1: n = 9 (B) or n = 6 (D). (DN: double negative for CD4 and CD8; iso: staining using an isotype control antibody instead of an anti-NK1.1 antibody). (Horizontal bars indicate mean percentage).
