


Figure 3. CD161 expression and TCR-Vβ skewing in human CLL.
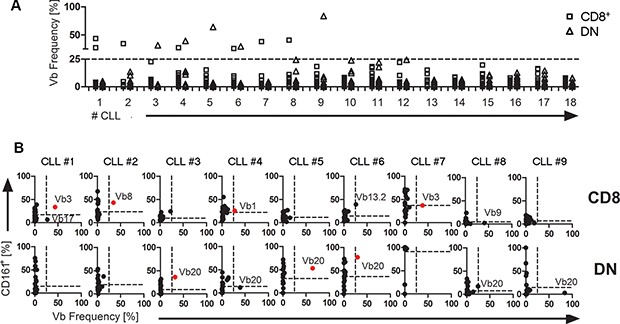
TCR-Vβ usage and CD161 expression within CD8+ or DN T cells (CD3+) were quantified by flow cytometry from peripheral blood of 18 CLL patients. (A) The frequency of 24 distinct TCR-Vβ elements within CD8+ (square) or DN (triangle) T cells (CD3+) were analysed for 18 CLL patients. A ticked horizontal line at 25% marks the threshold for overrepresentation. (B) For nine CLL samples with overrepresented T cells, expression values for 24 TCR-Vβ elements were plotted against CD161 expression. A TCR-Vβ usage of more than 25% was considered overrepresented (the 25% threshold is indicated by a vertical ticked line within each plot). The mean percentage of CD161+ cells of all TCR-Vβ subsets is shown as horizontal ticked lines. TCR-Vβ-specific T cells within the upper right quadrant (shown in red) are defined as overrepresented T cells with substantial CD161 expression. (the respective overrepresented Vβ element is indicated within each plot).