


Figure 4. CD1d expression in TCL1 mice and human CLL samples.
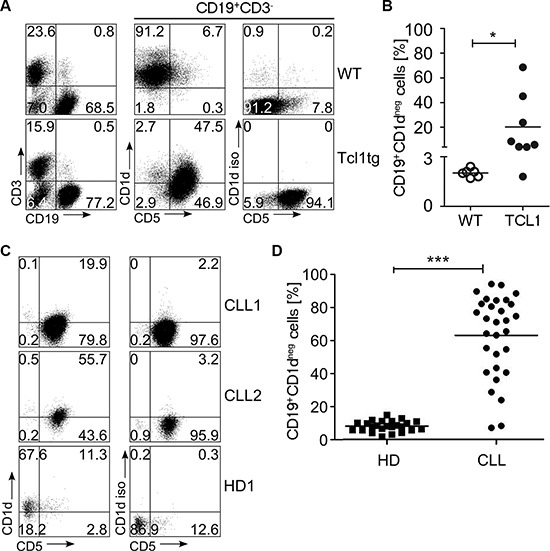
CD1d was measured on the surface of TCL1 and wildtype (WT) mouse splenocytes. (A) A representative FACS plot is shown. (B) Shown is the fraction of CD1d negative samples among CD19+ WT B cells (n = 6) and the tumor cell population of TCL1 mice (n = 8). (C) A representative FACS stain of CD1d on the surface of human CLL samples and B cells from healthy controls (HD) is shown. (D) The fraction of CD1d negative cells for CLL (n = 30) and HD (n = 24) was determined as shown in (A). (Horizontal bars indicate mean percentage).