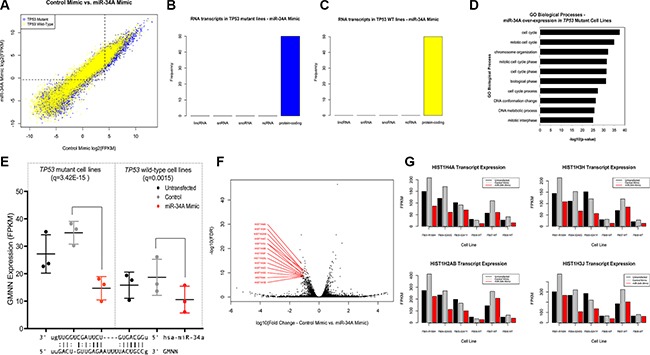
Figure 2.

(A) Distribution of differentially expressed transcripts in TP53 mutant and wild-type fibroblast cell lines with elevated miR-34A expression relative to controls. Distribution of differentially expressed transcripts in both TP53 mutant cell lines (blue) and wild-type cell lines (yellow). Points above and to the left of the dotted line indicate transcripts that are expressed at low levels in cell lines transfected with a control mimic but elevated in cell lines with high relative miR-34A levels. (B–C) Distribution of differentially expressed transcripts in (A) TP53 mutant and (B) wild-type cell lines transfected with miR-34A mimic by RNA classification. Each bar represents a class of RNA (lincRNA: long intergenic non-coding RNA; snRNA: small nuclear RNA; snoRNA: small nucleolar RNA; ncRNA: non-coding RNA, other or uncharacterized). The vertical axis depicts the frequency of this RNA class in the top 50 differentially expressed transcripts in TP53 mutant lines (blue) and TP53 wild-type lines (yellow). (D) GO Biological Processes enriched in TP53 mutant fibroblast cell lines transfected with miR-34A mimic. The –log10 (p-value) of enrichment is given on this horizontal axis and GO biological processes are annotated on the vertical axis. (E) Dot plot of GMNN expression across 3 TP53 mutant and 3 wild-type cell lines. miR-34A-GMNN base complementarity is given below. The miR-34A seed sequence begins at position 2 from the 5′ end of the transcript. (F) volcano plot of differentially expressed Histone H1 transcripts in TP53 mutant fibroblast cell lines with elevated miR-34A expression. The horizontal axis depicts the log10- transformed fold-change of transcript expression in cells transfected with miR-34A mimic relative to control. The vertical axis depicts the –log10(FDR) values for each transcript. The Histone H1 transcripts with the lowest FDR values are annotated in red. (G) Expression of Histone H1 transcripts in TP53 mutant and wild-type cell lines transfected with elevated miR- 34A expression. Four representative plots are shown for the Histone H1 transcripts with the lowest FDR values. In each plot, the respective cell line per three bars is provided on the horizontal axis, below the cell line transfected with control mimic. Black bars indicate untransfected lines and red bars indicate cell lines transfected with miR-34A mimic. The vertical axis depicts the FPKM expression value for each transcript across all cell lines at each transfection condition.
