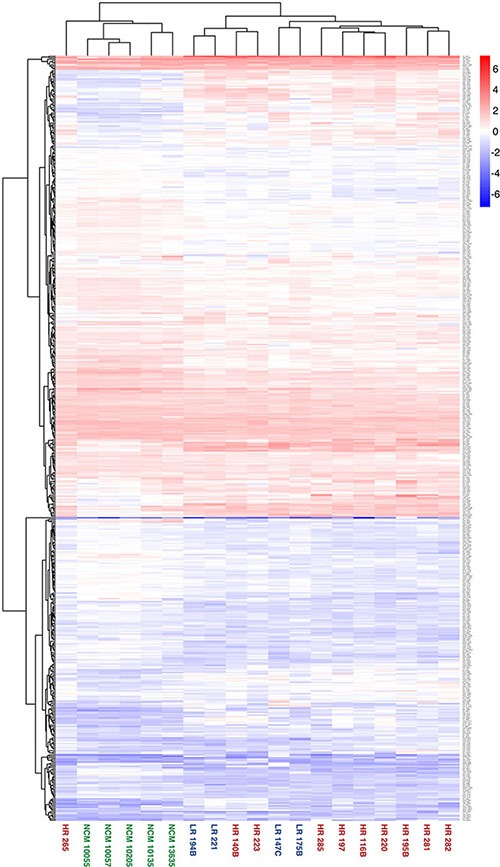
Figure 3. Heatmap showing highest level of separation discriminating between the secretomes from NCM and primary UM cells.

Hierarchical clustering of secretome sample based on label free abundance. The entire dataset of database matches for each secretome was used to direct a hierarchical clustering analysis, with log transformed label free quantification being used as the parameter. Samples from each subgroup are highlighted in a common colour; NCM = green, LR = blue, HR = red.
