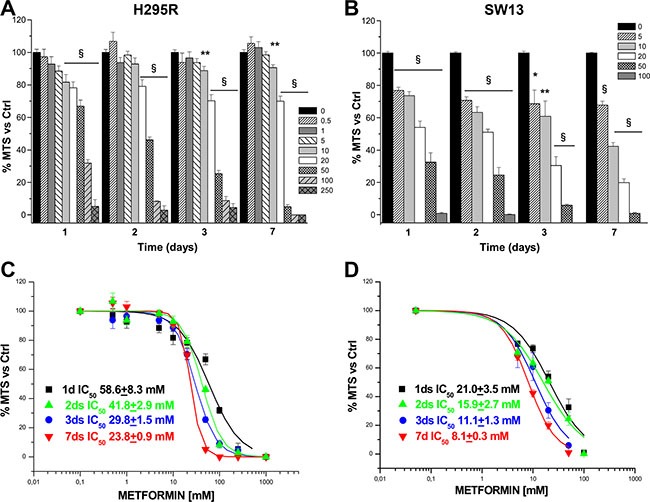
Figure 1. Metformin inhibits H295R and SW13 cell viability.

Cell viability was assessed by using MTS assay in H295R (A) and SW13 (B) cells grown in the presence or absence of increasing doses of metformin (mM) at the indicated time points. Data are expressed as mean ± SE of absorbance percentage vs. non-stimulated controls in n = 5 independent experiments. Statistical analysis was performed with ANOVA followed by Dunnett's post hoc test: *P < 0.05, **P < 0.01, §P < 0.0001 vs respective controls. Metformin IC50s for cell viability were calculated on the dose-response curves obtained at the indicated time points in H295R (C) and SW13 (D) cell lines.
