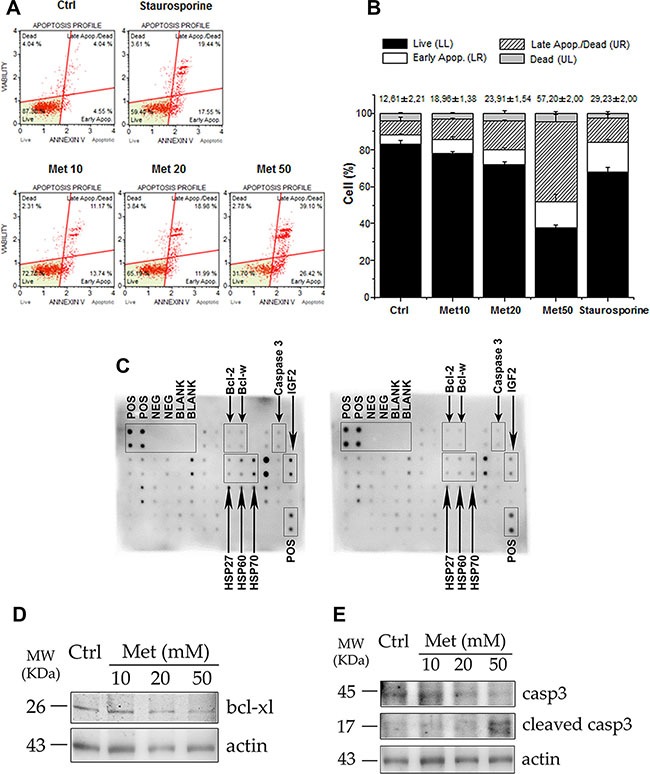
Figure 4. Metformin stimulates apoptosis in H295R cell line.

(A) After 48 hour treatment with increasing doses of metformin (Met 10, 20, 50 mM), H295R cells were trypsinized and analyzed with a Muse automated cell analyzer, using the Muse Annexin V/Dead Cell Assay. This analysis enabled differentiation, on the basis of annexin V positivity, of four populations of cells for each sample: live, early apoptotic, late apoptotic, and dead cells. Cells treated overnight with 0.2 μM staurosporine were used as positive controls of apoptosis induction. (B) Bar chart represents mean ± SE of cell percentage for each population identified with Annexin V assay. Mean percentage ± SE of total apoptotic cells related to each sample is also indicated above bar charts. Statistical analysis was performed with ANOVA followed by Dunnett's post hoc test: *P < 0.05, **P < 0.001, §P < 0.0001 vs respective controls. (C) Protein array membranes for apoptosis were incubated with protein extracts from control (left panel) and 20 mM metformin-treated for 48 hours (right panel) cells. Positive and negative spots are indicated, as well as the apoptosis proteins of interest (arrows). (D, E) Western blot analysis of protein extracts from H295R treated or untreated with the indicated doses of metformin for 48 hours: treated cells show decreased expression of Bcl-xl and an increase in the cleaved active fragments of caspase 3, accompanied by a decrease in the intact form, compared to the control. Actin was used as internal protein loading control.
