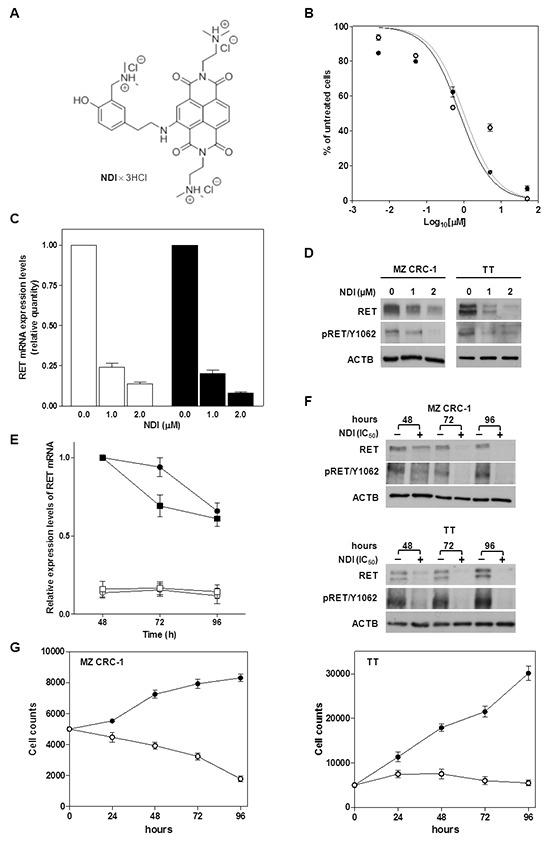
Figure 1. Exposure of MTC cells to the NDI derivative resulted in the impairment of cell growth and in a remarkable down-regulation of RET expression.

A. Chemical structure of the NDI derivative [17]; B. Cell growth inhibition curves obtained upon a 48-h exposure of MZ CRC-1 (●) and TT cells (○) to increasing concentrations (Log10[μM]) of NDI. Data have been reported as percentage of growing cells in treated vs. untreated cells and represent mean values ± s.d.; C. Real-time RT-PCR assessment of RET mRNA expression in MZ CRC-1 (white columns) and TT (black columns) cells exposed for 24 h to increasing concentrations of NDI. Quantification of RET mRNA levels was carried out according to the 2-ΔΔCt method. Data have been reported as RET mRNA relative quantity in treated vs. untreated cells and represent mean values ± s.d.; D. Representative western immunoblotting showing basal and phosphorylated (pRET/Y1062) RET protein amounts in MTC cells exposed for 24 h to the indicated concentrations of NDI. β-actin (ACTB) was used to ensure equal protein loading; E. Time-course assessment of RET mRNA expression levels in untreated MZ CRC-1 (●) and TT (■) cells and after the exposure to an equitoxic amount of NDI (MZ CRC-1 (○) and TT (□)). Data have been reported as RET mRNA relative amounts in untreated and NDI-treated cells, according to 2-ΔC'T method [39], and represent mean values ± s.d.; F. Representative western immunoblotting showing the time-course assessment of basal and phosphorylated (pRET/Y1062) RET protein amounts in untreated and NDI-treated MZ CRC-1 (upper panel) and TT (lower panel) cells; G. Time-course evaluation of cell growth in untreated (●) and NDI-treated (○) MZ CRC-1 (left panel) and TT (right panel) cells. Data have been reported as number of growing cells and represent mean values ± s.d.
