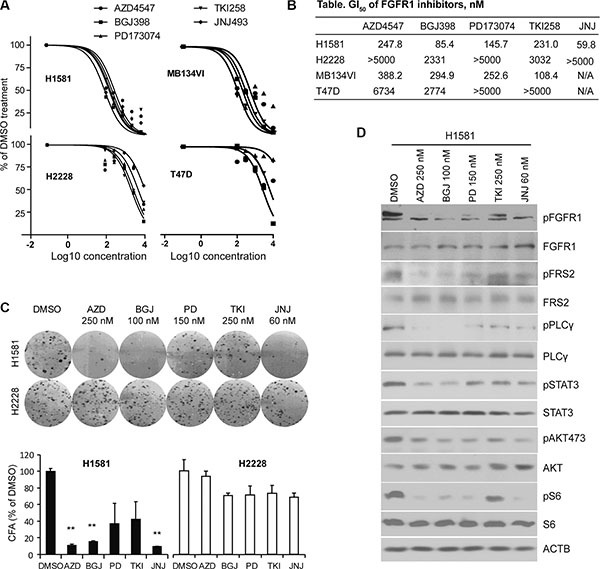
Figure 1. GI50 levels for lung and breast cancer cells treated with FGFR inhibitors.

(A) Growth inhibition curves, performed in quadruplicate, for human lung cancer (H1581 and H2228) and breast cancer (MB-134VI and T47D) cells treated with 5 different pan-FGFR inhibitors. H1581 and MB-134VI cells carry FGFR1 amplification. To avoid confusing congestion within the figure by including all four individual data marks and related standard deviations, only mean values are plotted, although in all cases SD values were < 10% of the meanvalue. (B) Summary of the GI50 concentrations for each of FGFR inhibitors. All cell lines were treated with the individual FGFR inhibitors at 0, 300, 1000, 3000, 10,000 nM for 72 h. GI50 values were calculated using GraphPad Prism 5 software. (C) The FGFR inhibitors remarkably suppress colony formation for H1581 cells but not H2228 cells. Data are presented as mean ± SD. * = p < 0.05, ** = p <0.01 compared with the vehicle-treated control. (D) Western blot analysis (at least in duplicate for all proteins) shows that the phosphorylation levels of FGFR1 and its downstream signaling targets were dramatically reduced by all FGFR inhibitors in H1581 cells.
