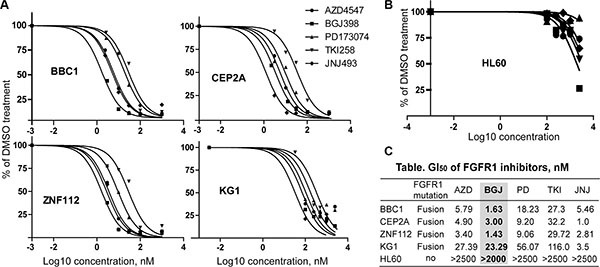
Figure 2. GI50 of leukemic cell lines for FGFR inhibitors.

(A) Growth inhibition curves (preformed in quadruplicate) for murine leukemic cell lines (BBC1, CEP2A, and ZNF112) and the human KG1 AML cell line following treatment with 5 different pan-FGFR inhibitors. To avoid confusing congestion within the figure by including all four individual data marks and related standard deviations, only mean values are plotted, although in all cases SD values were < 10% of the mean value. (B) Growth inhibition curve for HL60 human acute myeloid leukemia cells, which do not express FGFR1. (C) Summary of GI50 values for each of the FGFR inhibitors. GI50 value (the concentration for 50% of maximal inhibition of cell proliferation) was calculated using GraphPad Prism 5 software. BGJ398 is highlighted to show consistent inhibition across all FGFR1 expressing cell lines.
