
Figure 1. TCTP is a potential biomarker of CRC.
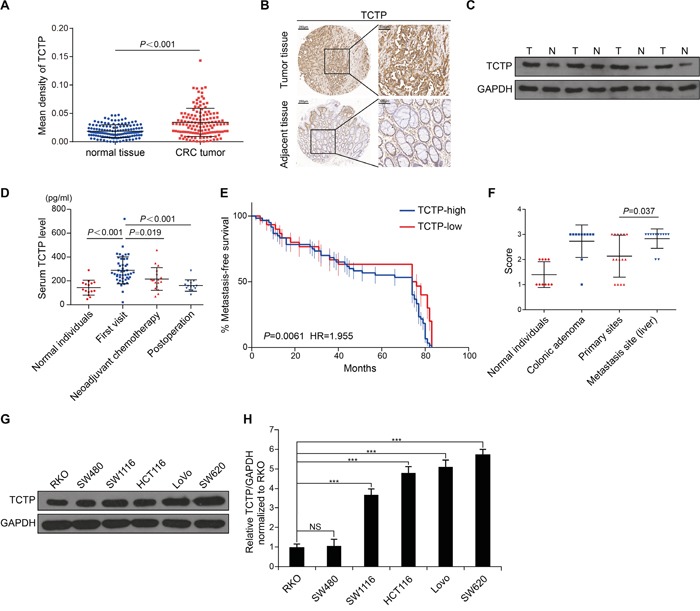
A. The expression levels of TCTP in 134 paired tumor tissues and adjacent tissues were detected by immunohistochemistry (IHC). B. Representative IHC images of TCTP expression in paired tumor and adjacent tissues. C. Western blot analysis of TCTP expression in four paired tumor and adjacent tissues. GAPDH served as a loading control. D. Bar graph showing TCTP expression in the serum of 93 CRC patients measured by ELISA. P value was calculated by One-Way ANOVA. E. Kaplan–Meier analysis of metastasis-free survival of 90 CRC patients, as a comparison of tumors expressing high TCTP versus low TCTP. P=0.0061 by long rank test. F. TCTP IHC staining score of normal individuals, colonic adenoma, primary sites, and metastasis sites. P=0.037 by Mann–Whitney U test. G. Western blot analysis of endogenous TCTP expression in six CRC cell lines. GAPDH served as a loading control. H. Relative TCTP mRNA levels (normalized to TCTP mRNA level in RKO) in six CRC cell lines. ***P<0.001 by One-Way ANOVA. NS: no significance.