
Figure 3. Extracellular TCTP promotes cell migration and invasion.
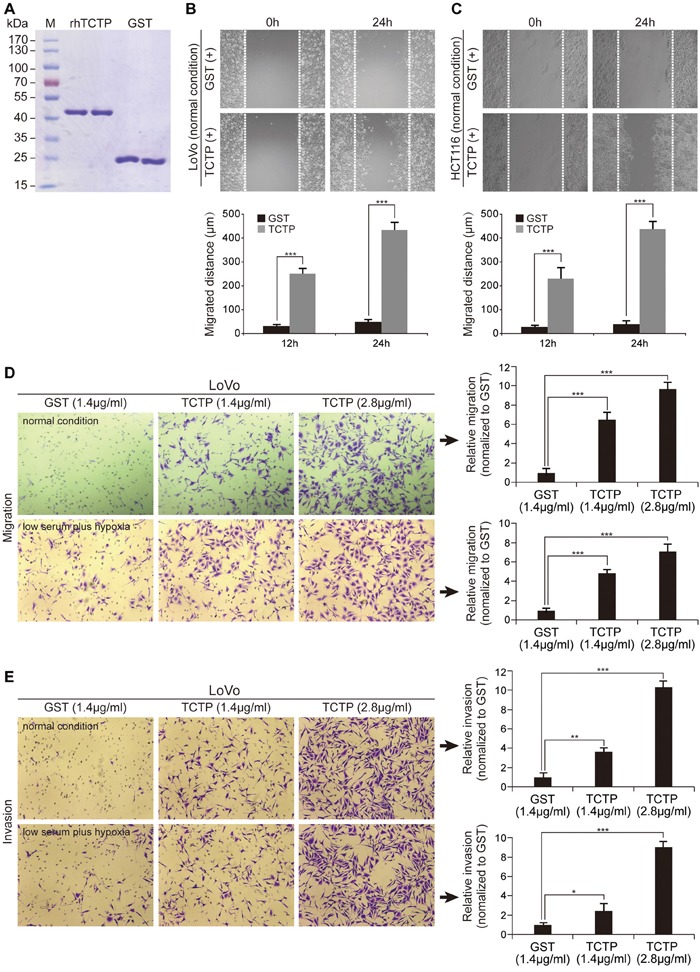
A. Coomassie blue staining of purified rhTCTP and prokaryotic GST. B. Wound closure of LoVo cells induced by rhTCTP or GST stimulation was measured from 0 to 24h. Migration distances are shown (right). ***P< 0.001. C. Cell migration of HCT116 cells induced by rhTCTP or GST stimulation was determined by the wound-healing assay. Migration distances are shown (right). ***P< 0.001. D. Migration ability of LoVo cells induced by different concentrations of rhTCTP or GST was determined by the Transwell assay (left) either under normal conditions or low serum plus hypoxic conditions. Relative migration ability was normalized to the control GST group (right). The data set shown is representative of three experiments. Magnification: 100×. Error bar indicates SD. ***P< 0.001. E. Different concentrations of rhTCTP or GST induced LoVo cell invasion in a Boyden chamber invasion assay either under normal conditions for 24h or low serum plus hypoxic conditions for 12h. Representative images from three independent repeated experiments are shown (left panel). Relative invasion ability was normalized to the control GST group (right). Data represents mean ± SD. *P< 0.05, **P< 0.01, ***P< 0.001.