
Figure 1. Colorectal cancer exosomes induce changes in colonic MSC morphology and growth rate.
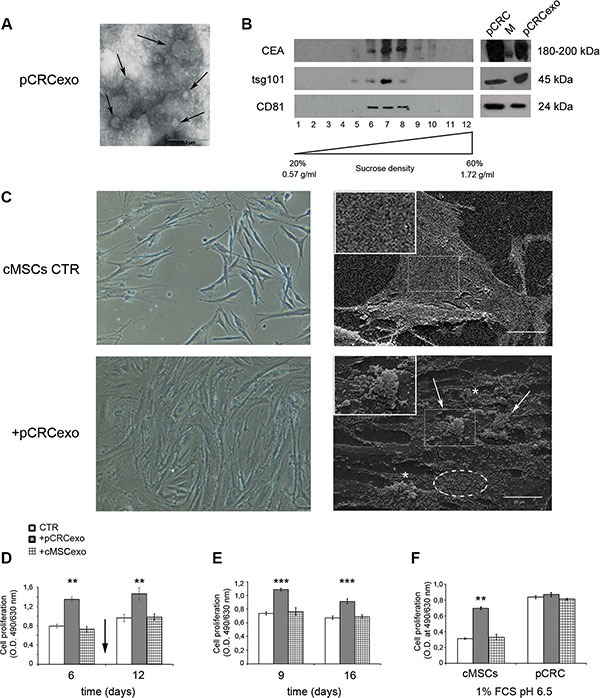
(A) Transmission electron microscopy image of SW480 primary CRC derived exosomes (pCRCexo). Arrows indicate different size nanovesicles. Scale bar, 0.2 μM. (B) Western blot analysis of sucrose gradient fractions of pCRCexo blotted for the detection of carcinoembryonic antigen (CEA), tsg101 and CD81 (ubiquitous exosome markers) molecules. The density in which exosomes float corresponds to the tsg101- and CD81-positive fractions, and it is comprised between 0.90 and 1.22 g/ml. Total protein extracts of pCRC cells and their purified exosomes (pCRCexo) were loaded as control. M is the weight molecular protein marker; 1–12 correspond to the twelve fractions from sucrose density gradient. (C) Phase contrast microscopy (left panels) and scanning electron microscopy (SEM, right panels) images of colonic MSCs (cMSCs) treated for 6 days with pCRCexo. Arrows, asterisks and dotted circle indicate pseudopods, microvilli and vesicles respectively. 20X magnification in contrast microscopy; in SEM scale bar, 20 μM. Inserts represent a 2X magnification. Representative images of two independent experiments are reported. (D) Cell proliferation of cMSCs exposed to pCRCexo or cMSCs derived exosomes (cMSCexo) for 6 and 12 days; arrow indicates the exosomes re-feeding at day 9; proliferation was measured at day 6 and 12. (E) Cell proliferation of cMSCs incubated with pCRCexo or cMSCexo for 9 days and then replated in fresh medium without exosomes for other 7 days; proliferation was measured at day 9 and 16. (F) Cell proliferation of cMSCs or SW480 primary CRC (pCRC) cells incubated with pCRCexo or cMSCexo for 6 days at 1% FCS and pH 6.5 culture conditions. Results in D, E and F are expressed as optical density (mean ± SD, n = at least three independent sets of experiments (**p ≤ 0.005; (***p ≤ 0.001;), compared to untreated cMSCs (CTR).