
Figure 3. Colorectal cancer exosomes promote colonic MSC spheroids formation.
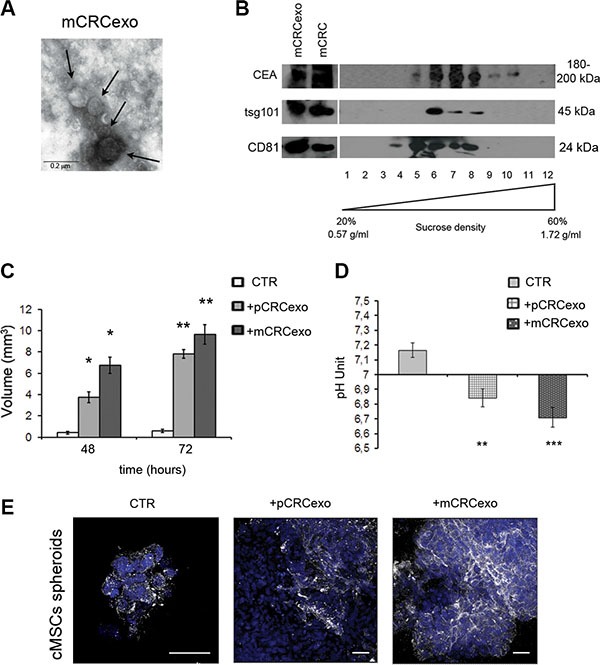
(A) Transmission electron microscopy image of SW620 metastatic CRC derived exosomes (mCRCexo). Arrows indicate different size nanovesicles. Scale bar, 0.2 μM. (B) Western blot analysis of sucrose gradient fractions of mCRCexo blotted with CEA, tsg101 and CD81 (ubiquitous exosome markers). The density in which CEA+ exosomes float, correspond to the tsg101+ and to the CD81+ fractions, and it is comprised between 0.95 and 1.25 g/ml. Total protein extracts of mCRC and mCRCexo were loaded as control. 1–12 correspond to the twelve fractions from sucrose density gradient. (C) Measurements of the volume of colonic MSC spheroids (CTR), formed after the pCRCexo or mCRCexo treatments at 48 and 72 h. (D) pH measurements of colonic MSCs spheroids supernatants, derived from pCRCexo- or mCRCexo-treated spheroids (at 72 hours) compared to supernatants of untreated ones (CTR). Statistical analysis were performed by unpaired Student t-test (*p ≤ 0.05; **p ≤ 0.005; ***p ≤ 0.001). (E) Confocal laser scanning microscopy of cMSCs spheroids incubated or not (CTR) with pCRCexo and mCRCexo and stained for V-ATPase proton pump molecule, followed by Alexa Fluor®-488-conjugated secondary Ab (shown in white). Nuclei are reported in blue (DAPI). Scale bar, 40 μM.