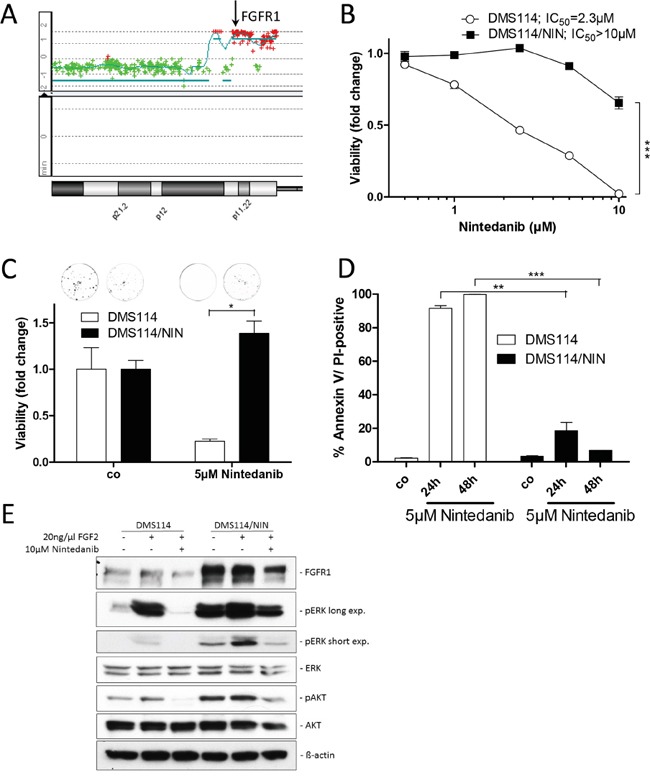
Figure 1. Generation of a FGFR1-driven SCLC cell line with acquired nintedanib resistance.

A. aCGH analysis was used to elucidate relative gene dose changes of DMS114 cells in comparison to normal human reference DNA. Results for the chromosome 8p arm are shown and the FGFR1 gene locus is indicated by the arrow. B. Viability of DMS114 and DMS114/NIN cells was analyzed by MTT assay after 72 hours exposure to the indicated concentrations of nintedanib. *** p < 0.001, 2-way ANOVA, Bonferroni post-test. C. Impact of long-term (10d) nintedanib-exposure on clone formation capacity of DMS114 and DMS114/NIN cells was evaluated by crystal violet staining of fixed cells. Quantification was performed by densitometric measurement of stained cells using ImageJ software. Data are presented as relative values normalized to untreated controls. * p < 0.05, unpaired t-test. D. Apoptotic cell death induction was analyzed by Annexin V/PI-staining and FACS after 24 and 48 hours of 5μM nintedanib treatment of DMS114 and DMS114/NIN cells. ** p < 0.01 and *** p < 0.001, unpaired t-test. E. Expression/phosphorylation of FGFR1 and selected downstream signaling proteins in DMS114 and DMS114/NIN cells was analyzed by Western blot of total cell lysates of serum-starved cells, pre-incubated for 1h with the indicated concentration of nintedanib and stimulated for 15min with 20ng/ml FGF2. ß-actin was used as loading control.
